Announcement

Collapse
No announcement yet.

How to get an alert

Collapse
This topic is closed.
X
X
 
  • Filter
  • Time
  • Show
Clear All
new posts

  • #16
    TraderBambu, Juice (and your friend)
    Thank you both for the compliments.

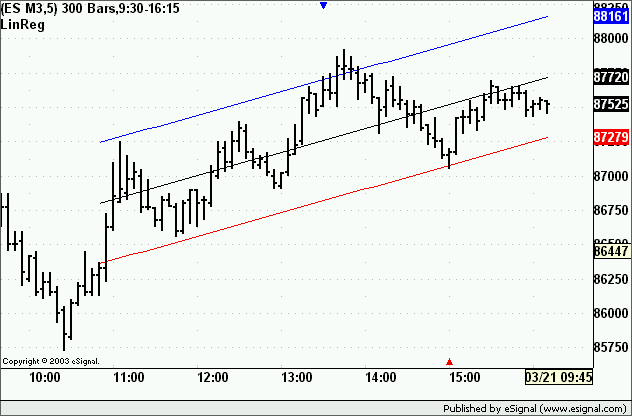
    Also, here below is a modification that was requested by someone who needs to paint the bars with another efs but would still like to see which bars cross the Linear Regression. Substitute the corresponding sections in the efs.

    function onAction1() {
    //setPriceBarColor(Color.RGB(0,0,255));
    if (vLastAlert != 1) Alert.playSound("C:\\PROGRAM FILES\\ESIGNAL\\Sounds\\Ding.wav");
    if (vLastAlert !=1) drawShapeRelative(0, 5, Shape.DOWNTRIANGLE , null, Color.blue, Shape.RELATIVETOTOP,1);
    vLastAlert = 1;
    }


    function onAction2() {
    //setPriceBarColor(Color.RGB(255,0,0));
    if (vLastAlert != 2) Alert.playSound("C:\\PROGRAM FILES\\ESIGNAL\\Sounds\\Ding.wav");
    if (vLastAlert !=2) drawShapeRelative(0, 0, Shape.UPTRIANGLE, null, Color.red, Shape.RELATIVETOBOTTOM,2);
    vLastAlert = 2;
    }

    The result is two triangles, one blue on the top border of the chart and one red on the bottom border of the chart that are plotted in correspondence of the bars that cross the Linear Regression Channel
    Alex
    Last edited by ACM; 03-20-2003, 09:47 PM.

    Comment


    • #17
      Is

      if (vLastAlert != 1) Alert.playSound("C:\PROGRAM FILES\ESIGNAL\Sounds\Ding.wav");


      missing some /'s?

      if (vLastAlert != 1)
      Alert.playSound("C:\\PROGRAM FILES\\ESIGNAL\\Sounds\\Ding.wav");

      my FW says yes

      Alert.playSound("C:\\Program Files\\eSignal\\Sounds\\Ding.wav")

      Comment


      • #18
        Re: Reply to post 'How to get an alert'

        David
        Sure was. Thanks for noticing that.
        I have corrected the original message.
        Alex

        Comment


        • #19
          Is there a way either:
          a) to draw those trianges for every cross and have them stay on the chart (instead of having them only at the most recent up & down crosses); or,
          b) even better, to write the price at the time of each cross to a text file (or anywhere else, really, for later examination).

          Thanks much,
          mats

          Comment


          • #20
            re leave triangles on chart..

            add

            bar=0;

            to the variable definiiton area before main(). Then change the following to

            function onAction1() {
            //setPriceBarColor(Color.RGB(0,0,255));
            bar=bar+1;
            if (vLastAlert != 1) Alert.playSound("C:\\PROGRAM FILES\\ESIGNAL\\Sounds\\Ding.wav");
            if (vLastAlert !=1) drawShapeRelative(0, 5, Shape.DOWNTRIANGLE , null, Color.blue, Shape.RELATIVETOTOP,1, bar);
            vLastAlert = 1;
            }


            function onAction2() {
            bar=bar+1
            //setPriceBarColor(Color.RGB(255,0,0));
            if (vLastAlert != 2) Alert.playSound("C:\\PROGRAM FILES\\ESIGNAL\\Sounds\\Ding.wav");
            if (vLastAlert !=2) drawShapeRelative(0, 0, Shape.UPTRIANGLE, null, Color.red, Shape.RELATIVETOBOTTOM,2, bar);
            vLastAlert = 2;
            }

            Comment


            • #21
              to write to a file

              put this near the top of main()

              today = new Date;
              my_day = today.getDate();
              my_month = today.getMonth() + 1;
              my_year = today.getFullYear();
              // FILENAME WILL LOOK LIKE ES-MM-DD-YYYY.txt
              Log1 = "ES"+"-"+ my_month + "-" + my_day + "-" + my_year+".txt";
              f1 = new File(Log1); // PUT IT IN FORMULA OUTPUT
              f1.open("a+");

              add this when you want to write something

              vString = CurHours+"."+CurMinutes+"."+CurSeconds+"."+sym+"." +curtext;

              debugPrintln(vString);
              f1.open("a+");
              f1.writeln(vString);


              and this near the bottom after done writing

              if(f1.isOpen()){
              f1.close();
              }

              Comment


              • #22
                David
                The solution to leave triangles on the chart does not seem to work.
                The triangles remain on the chart only as long as the conditions that plot them exist.
                Alex

                Comment


                • #23
                  I must have mis spoke about something, but this code leaves the triangles in place.
                  Attached Files

                  Comment


                  • #24
                    David
                    You may want to run this in Replay. As far as I can see it only leaves the triangles in place so long as the condition exists. Once the Regression Channel moves beyond - or changes to a point where an existing condition is no longer true (even if the bars are still contained within the channel) the triangles disappear.
                    BTW the same result as in the line.efs can be achieved by just setting the ID tag to null.
                    Alex

                    Comment


                    • #25
                      mine seem to be sticking...
                      Attached Files

                      Comment


                      • #26
                        David
                        Only because the arrows you have in the image you posted currently meet the condition. Once the Regression channel moves forward - and no longer includes them - or the channel widens and they no longer meet the condition the arrows will disappear.
                        That is why I suggested you try it in Replay.
                        Alex

                        Comment


                        • #27
                          thanks for the replies... the file writing is great for what i was hoping to do.

                          Comment


                          • #28
                            Linear Regression Values..

                            Hello, I am new to esignal.

                            Sorry, I posted a request BEFORE searching.

                            I found this topic which is exactly what I want however the numbers for linear regression from the files I downloaded don't match the linear regression numbers from the BASIC CHART.

                            I am set the advanced chart to a 2 day period just like my basic chart and 1 minute frequency.


                            I would really appreciate help with this.

                            Thanking You in Advance,

                            Avery

                            P.S. I am an old programmer from the 70's (when dinosaurs roamed and computers took up entire floors of buildings) so I should be able to understand this!

                            Comment


                            • #29
                              Thanks to Alexis and Jeff for helping via chat.

                              What I really want to be able to do is have the Linear Regression Alert for a list of stocks.

                              Since I can't do that on the alert list... my solution is to have a bunch of chart windows open with the lin reg alert formula.

                              Is there a way to make the chart BLINK or REVERSE VIDEO when the alert is triggered?

                              Also, how do I change the sound and make it louder?

                              Thanking You in Advance!

                              Comment


                              • #30


                                Is there a way to make the chart BLINK or REVERSE VIDEO when the alert is triggered?

                                Not that I am aware of. I would say the most visible way is with pop-ups using Alert.addToList(). An example of this usage is below.

                                Alert.addToList(getSymbol(), "CCI crossed above 100", Color.black, Color.blue);


                                Also, how do I change the sound and make it louder?

                                To change the sound look for the line...
                                Alert.playSound("C:\\PROGRAM FILES\\ESIGNAL\\Sounds\\Ding.wav");
                                ... and change the filename to the desired wav file. There are many different sounds preloaded in the Program Files\eSignal\Sounds\ folder. To make it louder, turn up your speakers.
                                Regards,
                                Jay F.
                                Product Manager
                                _____________________________________
                                Have a suggestion to improve our products?
                                Click Support --> Request a Feature in eSignal 11

                                Comment

                                Working...
                                X