Can you tell me more about the scaling? What are you expecting to see? This study doesn't look to be the same calc as the market delta images you posted. Is the result we're returning to the chart supposed to be a cumulative number? As it stands, it starts fresh on each new bar.
As for the candle coloring, we wouldn't be able to color the price bars in such a fashion. We could do some line drawing to create something similar, but the study would need to be a non-price study.
Jason K.
Project Manager eSignal - an Interactive Data company
Can you tell me more about the scaling? What are you expecting to see? This study doesn't look to be the same calc as the market delta images you posted. Is the result we're returning to the chart supposed to be a cumulative number? As it stands, it starts fresh on each new bar.
As for the candle coloring, we wouldn't be able to color the price bars in such a fashion. We could do some line drawing to create something similar, but the study would need to be a non-price study.
Your right, MarketDelta has a running total instead. My bad
How come equivolume can't be realtime? I haven't found any charting program able to do it realtime, is the calc too high?
As I remember, it was a pretty important point on being able to pull any useful info from the b/a vol efs' at all. I think it may be the same issue plumber was referring to at the beginning of this thread... but I'm not sure if that's what he was talking about. Anyway, please let us know.
Thanks, I'll have to give it a try Monday. Here's another idea, how about painting the bars according to ask-bid pressure. Using say red and 2 more lighter shades for 400, 200, 50 respectively and the opposite for green. This would be about the same as equivolume but would just be a simpler solution. Kind of like a heat candle, the more or less the volume per time period makes it change colors. Just a thought, I'm not giving up MarketDelta but suggesting a poor mans solution. I find their 2 and 3 tick reversal better myself, along with a ask-bid comulative study.
As I remember, it was a pretty important point on being able to pull any useful info from the b/a vol efs' at all. I think it may be the same issue plumber was referring to at the beginning of this thread... but I'm not sure if that's what he was talking about. Anyway, please let us know.
Thanks and regards,
Lorn
Lorn, I don't see any issues with the code. What I do see is it's incomplete. The T&S window has trade above ask and trade below bid, which isn't in the efs code. Make an efs with the following: trade @ ask, trade @ bid, trade above ask and trade below bid. The only other variable not included but is in the T&S window is trade inside, which is a blanket statement and makes for errors in the analysis and comparison of the efs' and T&S window. most would be amazed as to what some aggressive hedgies have. They custom make their own tools and the price action is analyzed to no end. Just to get a taste of what I'm talking about, look at the efs code for the simple bidaskvolume efs and multiply this by 10 and you can understand as to the scope of the analysis done.
Originally posted by theplumber Lorn, I don't see any issues with the code. What I do see is it's incomplete. The T&S window has trade above ask and trade below bid, which isn't in the efs code. Make an efs with the following: trade @ ask, trade @ bid, trade above ask and trade below bid. The only other variable not included but is in the T&S window is trade inside, which is a blanket statement and makes for errors in the analysis and comparison of the efs' and T&S window. most would be amazed as to what some aggressive hedgies have. They custom make their own tools and the price action is analyzed to no end. Just to get a taste of what I'm talking about, look at the efs code for the simple bidaskvolume efs and multiply this by 10 and you can understand as to the scope of the analysis done.
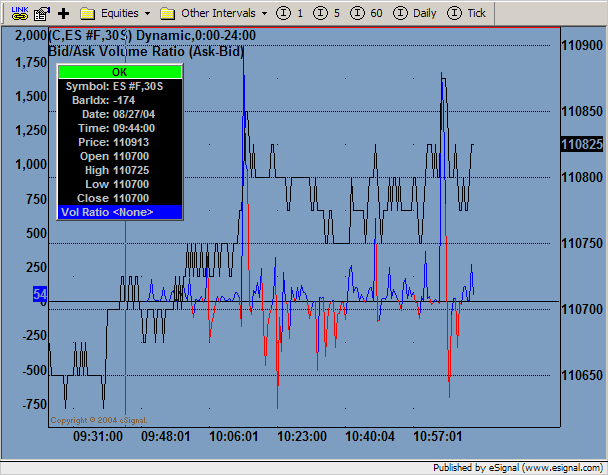
Here's another variable I didn't see before. The 1 contract @ 110650 in dark red with white letters is a new low. Of course during market hours this will be larger than 1 contract and in a seperate category in the time/sales data that will show a discrepency with any efs that doesn't include this variable.
No the problem has not been addressed as far as I know. The problem is related to the interval type. As a work around, if you use a tick based interval such as 60S instead of 1 minute, you'll get the proper execution of the EFS.
Jason K.
Project Manager eSignal - an Interactive Data company
It is my understanding that the Bid/Ask Volume Ratio study plot is based on the last Close and last Bid and Ask quotes, right? For example, if I have that study on a 5 minute chart, then the study plots at the completion of that bar depending upon what the closing price was in relation to the Bid and Ask for the last tick.
If my understanding is correct, then it would give a completely wrong picture of where volume traded (at the Bid or Ask) during that timeframe. Attributing the whole volume depending on how the last tick went is not right.
Is it possible to have the system classify the volume as Bid volume or Ask volume for each trade that takes place during that timeframe (may be like a counter), sum them up separately and then plot the delta or the ratio at the completion of that bar or in real time? This might give a clearer picture. I look forward to your comments. Thanks for all your help.
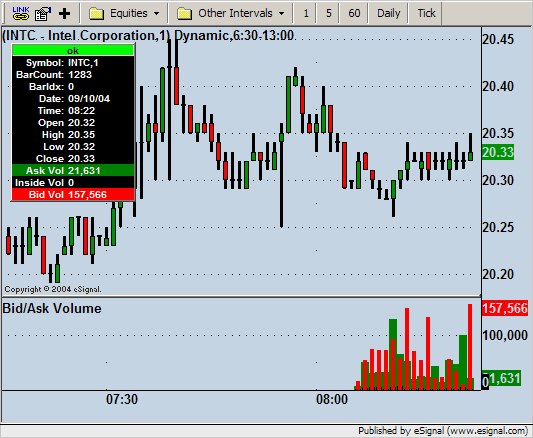
Your understanding is not correct. The getMostRecentAsk() and getMostRecentBid() functions only work in real time. So on a historical basis, we cannot calculate the trade volume at the bid and trade volume at the ask because EFS only processes completed bars on the initial load of the formula. In real time however, BidAskVolume.efs will give you the totals you're looking for. The green histogram is the volume traded at or above the most recent ask for each trade that takes place during the time frame , not just at the close of the bar. The red histogram is the volume traded at or below the most recent bid and the black is inside volume. If you run the formula in real time you will see the histograms build on a trade by trade basis.
I'm noticing today that the BidAskVolumeRatio.efs I made earlier in this thread is not working properly for the Bid/Ask or Ask/Bid sources because of some changes I made for the Bid-Ask and Ask-Bid sources. The question to you now is do you want to see the ratio on a cumulative or bar-by-bar basis? I suppose we could do it both ways.
Jason K.
Project Manager eSignal - an Interactive Data company
Another idea would be to paint the background lime green and print the ask volume a red histogram to look like this, or the other way around, doesn't matter.
How did you get that?? It is fantastic man. Is there another version of this efs floating around that does this? Please let me know. Or is it what you want it to look like? If so, Jason, can you do that?? That would be great.
 Tweet
Tweet

Comment