Announcement

Collapse
No announcement yet.

Bid_Ask Volume efs

Collapse
X
 
  • Filter
  • Time
  • Show
Clear All
new posts

  • #76
    Hello Peter,

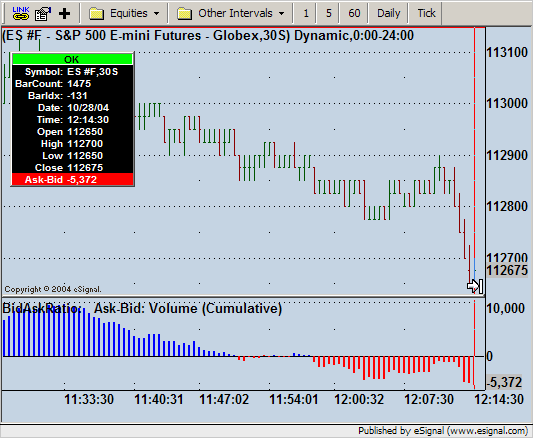
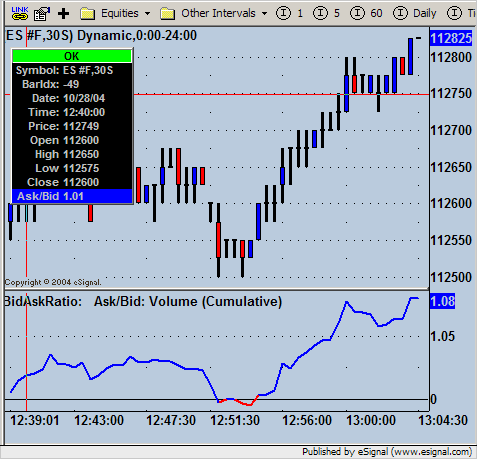
    I did some searching and didn't find that exact formula. However, earlier in this thread, I posted a BidAskRatio.efs that I'm planning to revisit. I'll look into adding an option that would reproduce the difference histogram.
    Jason K.
    Project Manager
    eSignal - an Interactive Data company

    EFS KnowledgeBase
    JavaScript for EFS Video Series
    EFS Beginner Tutorial Series
    EFS Glossary
    Custom EFS Development Policy

    New User Orientation

    Comment


    • #77
      Hello Peter,

      Here's the new formula, BidAskRatio.efs. The formula I referenced in my previous post was supposed to be BidAskVolumeRatio.efs. BidAskRatio does the same thing and more. This new formula has some of the same options as the BidAskAnalysis.efs so you can choose the type of analysis (Bar or Cumulative), the type of output (Ask/Bid, Ask/Total, Bid/Total, or Ask-Bid) and the source (Ticks or Volume). It also has the option to choose the plot type (Line or Histogram).

      Here's the result of the study you requested similar to Plumber's chart.


      Here's the cumulative volume of Ask/Bid.


      Ask-Bid cumulative ticks.


      There's a few other possible combinations, just try them out. Any suggestions or feedback welcomed.
      Jason K.
      Project Manager
      eSignal - an Interactive Data company

      EFS KnowledgeBase
      JavaScript for EFS Video Series
      EFS Beginner Tutorial Series
      EFS Glossary
      Custom EFS Development Policy

      New User Orientation

      Comment


      • #78
        Jason,

        Thanx for you're help.

        Peter

        Comment


        • #79
          Hi Jasonk,

          Thanks for the efs... something I would definitely like to play with.

          I was wondering, however, if you could help stupid ol' me to understand what the difference between tick and volume as source is...

          By volume per bar... I'm pretty sure that means volume taken at the offer (bot the offer) shows up as green and volume given to the bid (sold the bid) shows up as red. Pls correct me if I'm wrong!

          By tick per bar... does this mean the number of ticks(trades) for offers taken and bids given? Or is this also volume of a different kind?

          Thanks for the help!

          Comment


          • #80
            Hello Anson,

            I assume you're talking about BidAskAnalysis.efs. Using Tick as the source only looks at trade counts, it excludes volume per trade. This allows you to see how many trades are occurring at the Ask, Bid, or inside.

            If you're analyzing the data on a Bar only basis, the totals are for that specific bar or interval. At the beginning of each new bar all totals start at 0. If you choose Cumulative, the data will be added to the previous bar's totals throughout the day. The Cumulative totals will reset to 0 at the beginning of each new day.

            The totals for Ask are green and Bid is red. If you don't like those colors, you can change them to your liking through the Edit Studies option.
            Jason K.
            Project Manager
            eSignal - an Interactive Data company

            EFS KnowledgeBase
            JavaScript for EFS Video Series
            EFS Beginner Tutorial Series
            EFS Glossary
            Custom EFS Development Policy

            New User Orientation

            Comment


            • #81
              Thanks for the details, Jason!

              The colors are the way I would want them too.

              Comment


              • #82
                HeikinAshi paint bars

                Jason,

                I would like to know if it would be possible to add a display of other HA paint bars on one time frame ( 5, 30, 90, D, W ) of other intervals which would display their current colors in real time so that one would have to toggle back and forth, to the
                eSignal_HeikinAshi.efs as in example enclosed.

                Peter
                Attached Files

                Comment


                • #83
                  Hello Peter,

                  Yes, this is possible, but not a simple process. It would require multiple formulas running on separate charts. Those formulas (which could be the same formula) would pass information (setGlobalValue()) to the universal global space shared between formulas. Then you would need another formula that would grab (getGlobalValue()) the global data and draw the shapes and text on your main chart.
                  Jason K.
                  Project Manager
                  eSignal - an Interactive Data company

                  EFS KnowledgeBase
                  JavaScript for EFS Video Series
                  EFS Beginner Tutorial Series
                  EFS Glossary
                  Custom EFS Development Policy

                  New User Orientation

                  Comment


                  • #84
                    Hey JasonK,

                    I was wondering if it would be possible to add a feature to your Bid/Ask Analysis efs so that it could filter out size like in the T&S. Say we only want trades of at least 50 lots to be included in the calculations etc...

                    I think this could add another interesting dimension.

                    Thanks
                    Anson

                    Comment


                    • #85
                      Hello Jason,

                      Would this be considered a custom efs that I woud need to speak to programing department about or can I request this efs
                      to be developed since I have no clue on how to write an efs.

                      Peter

                      Comment


                      • #86
                        Hello Anson,

                        Your suggestion is a good one and I will definitely look into adding this in the near future.
                        Jason K.
                        Project Manager
                        eSignal - an Interactive Data company

                        EFS KnowledgeBase
                        JavaScript for EFS Video Series
                        EFS Beginner Tutorial Series
                        EFS Glossary
                        Custom EFS Development Policy

                        New User Orientation

                        Comment


                        • #87
                          Hello Peter,

                          Your request would require custom programming and I think it does have valuable implications for the community as a whole. The Heikin Ashi bars seem to be a well-utilized study. However, this project would be programming intensive and we have limited programming resources for EFS development. I will certainly give this consideration for a future development project for the EFS library but I can't commit to it at this time. If this is something you feel is imperative for your personal trading system you can always take any of the open source code we provide and ask one of our EFS Consultants to modify or utilize it for a custom study.
                          Jason K.
                          Project Manager
                          eSignal - an Interactive Data company

                          EFS KnowledgeBase
                          JavaScript for EFS Video Series
                          EFS Beginner Tutorial Series
                          EFS Glossary
                          Custom EFS Development Policy

                          New User Orientation

                          Comment


                          • #88
                            Hello Jason,

                            Is there a particular EFS that I can start off with, if u can point me in the right direction that would be great.

                            Peter

                            Comment


                            • #89
                              what about using uptick/dntick

                              What about using uptick/dntick instead of trade at the bid/ask in order to have the charts backfill for back testing, etc.

                              Comment


                              • #90
                                Hello coolmoss,

                                EFS only processes completed bars on a historical basis for back testing. essentially, the EFS only executes once per bar, which would make the study appear to only have one tick. Analyzing intra-bar trades on a historical basis would not be possible.
                                Jason K.
                                Project Manager
                                eSignal - an Interactive Data company

                                EFS KnowledgeBase
                                JavaScript for EFS Video Series
                                EFS Beginner Tutorial Series
                                EFS Glossary
                                Custom EFS Development Policy

                                New User Orientation

                                Comment

                                Working...
                                X