Announcement

Collapse
No announcement yet.

Bid Ask Size Plot on Advanced Chart

Collapse
X
 
  • Filter
  • Time
  • Show
Clear All
new posts

  • Bid Ask Size Plot on Advanced Chart

    Hi!
    I would like to have a plot of bid and ask sizes on my tick charts (in an advanced chart).
    I found the following fuctions in your EFS Glossery:
    nAskSize = getMostRecentAskSize ()
    and
    nBidSize = getMostRecentBidSize ()
    (see attached html file)
    I was told by tech support that these will do it.
    The only problem is that I don't know how to program an EFS function.
    Could you please help me do this?
    Thanks!
    Steve
  • #2
    Hello Steve,

    We have some formulas in our EFS Library that might be what you are looking for. Try one of the following.

    BidAskSize.efs
    BidAskAnalysis.efs
    BidAskVolume.efs
    Jason K.
    Project Manager
    eSignal - an Interactive Data company

    EFS KnowledgeBase
    JavaScript for EFS Video Series
    EFS Beginner Tutorial Series
    EFS Glossary
    Custom EFS Development Policy

    New User Orientation

    Comment


    • #3
      Thanks for the reply!
      These are close, but still no cigar.
      BidAskSize.efs does indeed show the bid and ask size on the bottom, but it does not show them as a plot of tick history - it is more of a quote than a plot.
      The other two files show the amounts TRADED at or between the bid and ask. This is not, however, the bid or ask SIZE. The bid or ask size is the amount being reported by the specialist (in the case of NYSE stocks) of shares either demanded at the bid price, or offered as the ask price. I am NOT looking for how many shares actually ended up trading at the price.
      So, again, is there a way to plot the bid and ask size?
      Thanks
      Steve

      Comment


      • #4
        Hello Steve,

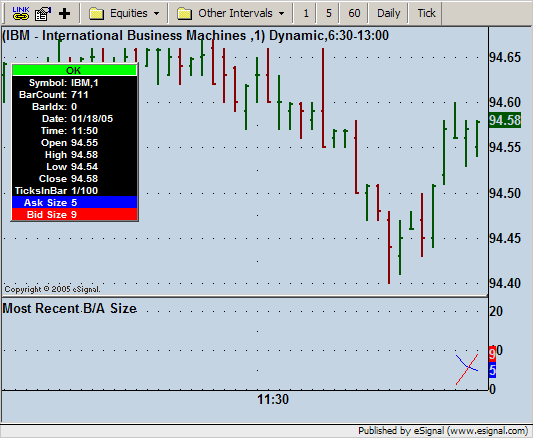
        Historical bid and ask information is not available through EFS. An EFS formula may collect bid/ask data in real time for display, but will not persist if the formula is reloaded. To plot the current bid/ask size values you can do something as simple as the following.

        PHP Code:
        function preMain() {
            
        setStudyTitle("Most Recent B/A Size");
            
        setCursorLabelName("Ask Size"0);
            
        setCursorLabelName("Bid Size"1);
            
        setDefaultBarFgColor(Color.blue0);
            
        setDefaultBarFgColor(Color.red1);
        }


        function 
        main() {
            if (
        getCurrentBarIndex() < -1) return;
            var 
        getMostRecentAskSize();
            var 
        getMostRecentBidSize();
            return new Array( 
        a);

        Jason K.
        Project Manager
        eSignal - an Interactive Data company

        EFS KnowledgeBase
        JavaScript for EFS Video Series
        EFS Beginner Tutorial Series
        EFS Glossary
        Custom EFS Development Policy

        New User Orientation

        Comment


        • #5
          Thanks!
          Your's works great! I was on track, but mine wasn't as professional looking as yours...
          OK, now how do I get historical Times and Sales data exported over to excel? Do I need to go to a different departement fopr that kind of help?

          Comment


          • #6
            Hello Steve,

            Exporting the data from the Time and Window is not possible at this time. Feel free to submit a request for this ability to [email protected].
            Jason K.
            Project Manager
            eSignal - an Interactive Data company

            EFS KnowledgeBase
            JavaScript for EFS Video Series
            EFS Beginner Tutorial Series
            EFS Glossary
            Custom EFS Development Policy

            New User Orientation

            Comment


            • #7
              Need help

              I would really like to install this program, but I know nothing of how to enter this formula. Could someone give me some instruction.

              Thanks in advance,
              Nate

              Comment


              • #8
                Nate
                First copy the code that is contained inside the php box in JasonK's message.
                Then in eSignal select Tools->EFS->Editor. This will open the EFS Editor window. Paste the code you just copied in the Editor and save the script in any one of the subfolders of Formulas.
                Then open or select the chart in which you want to load the efs. Right click that chart, select Formulas, navigate to the subfolder in which you saved the efs and click it.
                Hope this helps
                Alex

                Comment


                • #9
                  Thanks

                  thanks

                  Comment


                  • #10
                    More help?

                    I loaded this study along with the "bid/ask raw data" study. I would like to see this as a ratio.

                    Thanks,

                    Nate
                    Last edited by nathanlosey; 01-25-2005, 08:43 AM.

                    Comment


                    • #11
                      Hello Nate,

                      Try the attached. You may also want to check out the study parameters in Edit Studies. Let me know if this does what you're looking for.
                      Attached Files
                      Jason K.
                      Project Manager
                      eSignal - an Interactive Data company

                      EFS KnowledgeBase
                      JavaScript for EFS Video Series
                      EFS Beginner Tutorial Series
                      EFS Glossary
                      Custom EFS Development Policy

                      New User Orientation

                      Comment


                      • #12
                        Originally posted by JasonK
                        Hello Steve,

                        We have some formulas in our EFS Library that might be what you are looking for. Try one of the following.

                        BidAskSize.efs
                        BidAskAnalysis.efs
                        BidAskVolume.efs
                        Hi

                        I'd like to use the BidAskVolume study, but instead of bars I'd prefer to have a line chart. Is that possible?

                        Thanks

                        Comment


                        • #13
                          Hello laocoon,

                          Yes, open the formula in the editor (Tools-->EFS) and modify the thickness and plot type in preMain() on lines 19-24. Try something like below:

                          PHP Code:
                          // lines 19-24
                              
                          setDefaultBarThickness(20);
                              
                          setDefaultBarThickness(21);
                              
                          setDefaultBarThickness(22);
                              
                          setPlotType(PLOTTYPE_LINE0);
                              
                          setPlotType(PLOTTYPE_LINE1);
                              
                          setPlotType(PLOTTYPE_LINE2); 
                          Jason K.
                          Project Manager
                          eSignal - an Interactive Data company

                          EFS KnowledgeBase
                          JavaScript for EFS Video Series
                          EFS Beginner Tutorial Series
                          EFS Glossary
                          Custom EFS Development Policy

                          New User Orientation

                          Comment


                          • #14
                            How about putting a moving average on it as well as showing text on the screen, like this?

                            Here's a question, if the bidask volume lines are stored (obviously on the screen in the indicator window) but the text isn't? In other words why isn't the text stored on the screen like the line version? There should be text all over the screen, since it's the same efs as the line study below but showing test instead of histogram or lines.
                            Attached Files
                            Last edited by theplumber; 02-28-2005, 07:58 PM.

                            Comment


                            • #15
                              Hi

                              I have a question about the BidAskVolume.efs study.
                              If you compare the Ask Vol/Inside Vol/ Bid Vol data of the study (on a 1 minute chart) to the Time & Sales window, there appear to be some major inconsistencies.

                              If you add up all Trade at Ask & Trade above Ask trades of the Time&Sales for a 1 minute session, you should be getting the equivalent of the Ask Vol on the study, correct? (I assume the study is aggregating Trade at Ask & Trade above Ask into one single category, the Ask Vol. The same holds true for the Trade at Bid & Trade below Bid which doesn't match the volume as stated in the Bid Vol category of the study.

                              How can this be, since the study is supposed to have the Time&Sales as only data input?

                              Thanks.

                              Comment

                              Working...
                              X