Hi!
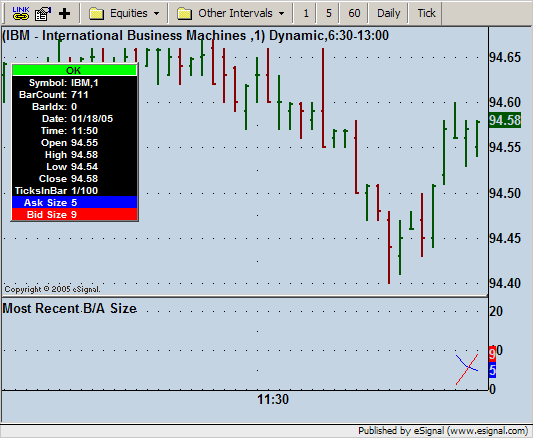
I would like to have a plot of bid and ask sizes on my tick charts (in an advanced chart).
I found the following fuctions in your EFS Glossery:
nAskSize = getMostRecentAskSize ()
and
nBidSize = getMostRecentBidSize ()
(see attached html file)
I was told by tech support that these will do it.
The only problem is that I don't know how to program an EFS function.
Could you please help me do this?
Thanks!
Steve

Comment