 Tweet
Tweet
Hello jethro87,
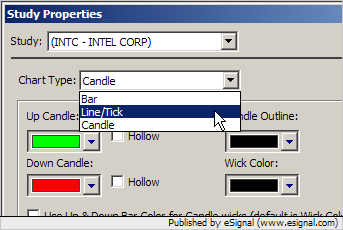
You do have the option to change the type (bar, line or candle) through Edit Studies (Chart Options-->Edit Studies). Select the study you wish to modify from the drop-down box at the top of the Study Properties window. The thickness is tied to the thickness settings for the main chart symbol.
There is a limit of 7 symbols in EFS.
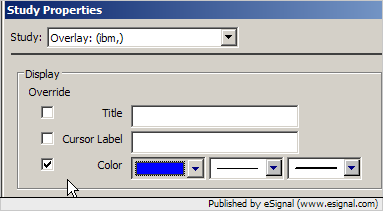
In Edit Studies, if you the select the display override for color, the study title will be set to the selected color.
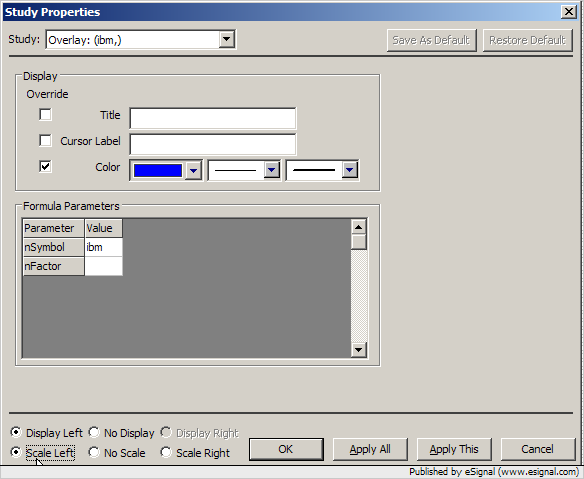
At the bottom of the Study Properties window that opens when you select the Edit Studies option, you will see the display controls at the bottom of that window for each study in the chart (or overlay). Select the options for "Display Left" and "Scale Left."
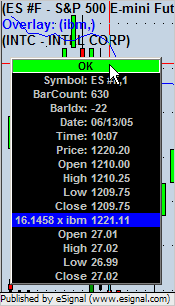
Try refreshing the chart by holding down the "Ctrl" key and then click on the green "OK" status label in the cursor window.
Originally posted by jethro87
Greetings.
With this overlay, you are able to control the line style and thickness. With manually adding multilpe chart symbols, you do not have this option.
Greetings.
With this overlay, you are able to control the line style and thickness. With manually adding multilpe chart symbols, you do not have this option.
With manually adding symbols, you are able to add only four extra symbols. Is there a limit with the number of EFS overlays that can be added? Not that I would load up a chart, I was just wondering.
Would someone tell me how to make the StudyTitle the same color of the line? As probtrader did in his attached chart.
Also, could you explain how to make the displayed symbol to display left and scale left in the EFS overlay?
I did an overlay of $ADD line on a $INDU candlestick chart. Just trying different time frames, I found that 1minute, 3minute, 5minute, ect., displayed fine. The 2minute chart displayed a "loading data" next to the symbol title. It never did load the data.
Comment