Announcement

Collapse
No announcement yet.

MACDColorHist.efs

Collapse
X
 
  • Filter
  • Time
  • Show
Clear All
new posts

  • MACDColorHist.efs

    The MACDColorHist.efs formula has been updated to incorporate a number of requested modifications listed below. The original configuration can still be achieved by disabling the display of the drop-down lines. This thread has also been split for house keeping purposes. The original replies to this thread can be found at the following link.

    MACDColorHist.efs - Modifications

    Requested Modifications:
    *Added FunctionParameter objects for user defined inputs.
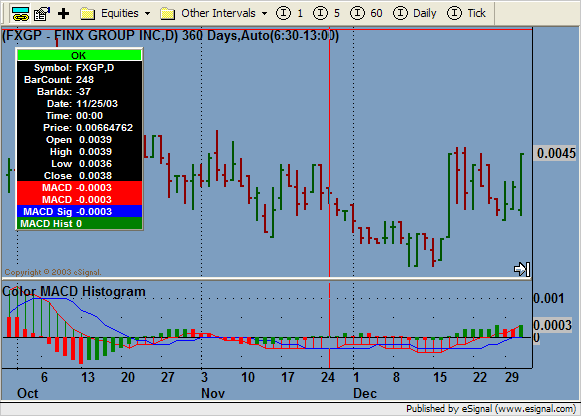
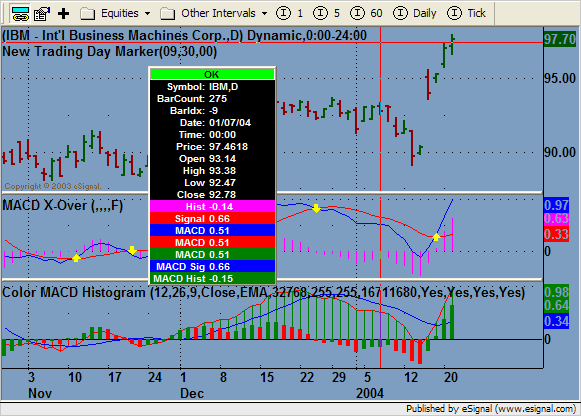
    *Added drop-down lines to the MACD where the color will match the up/down colors of the histogram up/down color settings. When MACD is positive, drop-down lines will be the up color and down color when the MACD is negative.
    *Added options to enable/disable MACD histogram, Signal, MACD and MACD drop-lines.
    Jason K.
    Project Manager
    eSignal - an Interactive Data company

    EFS KnowledgeBase
    JavaScript for EFS Video Series
    EFS Beginner Tutorial Series
    EFS Glossary
    Custom EFS Development Policy

    New User Orientation

  • #2
    MACD Color Histo Problem

    Hello Jason K,

    I downloaded the new MACD Color histogram and noticed that it doesnt work with penny stocks. If you try and use it on stocks valued .05 and under everything looks really rugged and difficult to read.

    Is there anyway to fix this. The one before this one worked perfect with stocks under 0.05.

    Here are some penny stocks that gave me problems.

    FXGP
    ADOT
    IBZT
    ZKID

    Comment


    • #3
      Hello Co|dStee|,

      I found the problem. It's an easy fix. Open your formula in the EFS editor and change the lines of code towards the end of main() that contain .toFixed(2) and change them to .toFixed(4). There are four of them. The changes will look like this:

      PHP Code:


      var vHdisplay vHist.toFixed(4)*1;
          if (
      bHist == "No"vHdisplay vHdisplay+"";
          var 
      vMdisplay vMACD.toFixed(4)*1;
          if (
      bMACD == "No"vMdisplay vMdisplay+"";
          var 
      vMdisplay1 vMACD.toFixed(4)*1;
          if (
      bDropLines == "No"vMdisplay1 vMdisplay1+"";
          var 
      vSdisplay vSig.toFixed(4)*1;
          if (
      bSignal == "No"vSdisplay vSdisplay+"";
          
          return new Array(
      vMdisplayvMdisplay1vSdisplayvHdisplay);

      Jason K.
      Project Manager
      eSignal - an Interactive Data company

      EFS KnowledgeBase
      JavaScript for EFS Video Series
      EFS Beginner Tutorial Series
      EFS Glossary
      Custom EFS Development Policy

      New User Orientation

      Comment


      • #4
        Thanks Jason it works now but i noticed something. When I compare your MACD Color EFS script to the original one the crossover points are not in the same position.

        Your MACD EFS script crossover happens later then the original is there a way to fix this.

        Thanks,
        Brian

        Comment


        • #5
          Hello Brian,

          Would you attach a copy of the "old" formula you are using? Did you happen to make any changes to it? I'll do some comparisons and see what I can come up with.
          Jason K.
          Project Manager
          eSignal - an Interactive Data company

          EFS KnowledgeBase
          JavaScript for EFS Video Series
          EFS Beginner Tutorial Series
          EFS Glossary
          Custom EFS Development Policy

          New User Orientation

          Comment


          • #6
            I compared your script with the original MACD script that comes with Esignal 7.5 and noticed that your script takes a couple days longer to crossover.

            I did not modify the original in anyway.

            Please try and compare your script with the MACDx-over one.

            Available at the EFS Help Center and Library

            /*********************************
            Provided By : eSignal. (c) Copyright 2003
            *********************************/


            function preMain() {
            setStudyTitle("MACD X-Over ");
            setDefaultBarFgColor(Color.magenta, 0); // hist
            setDefaultBarFgColor(Color.red, 1); // signal
            setDefaultBarFgColor(Color.blue, 2); // macd

            setPlotType(PLOTTYPE_HISTOGRAM, 0);

            setCursorLabelName("Hist", 0);
            setCursorLabelName("Signal", 1);
            setCursorLabelName("MACD", 2);
            }

            var study = null;
            var vMACD = null;
            var vMACD1 = null;
            var vSignal = null;
            var vSignal1 = null;
            var vAlert = false;
            var AlertCntr = 0;

            function main(nFastLength, nSlowLength, nSmoothing, nPriceSource, nSimpleMA_TorF) {
            var nState = getBarState();

            if (study == null) {
            if (nFastLength == null)
            nFastLength = 12;
            if (nSlowLength == null)
            nSlowLength = 26;
            if (nSmoothing == null)
            nSmoothing = 9;
            if (nPriceSource == null) {
            nPriceSource = "Close";
            } else if(nPriceSource == "C" || nPriceSource == "O" || nPriceSource == "H" || nPriceSource == "L")
            {
            nPriceSource = nPriceSource;
            } else if(nPriceSource == "Close" || nPriceSource == "Open" || nPriceSource == "High" ||
            nPriceSource
            ==
            "Low")
            {
            nPriceSource = nPriceSource;
            } else if(nPriceSource == "HL/2" || nPriceSource == "HLC/3" || nPriceSource == "OHLC/4") {
            nPriceSource = nPriceSource;
            } else {
            nPriceSource = "Close";
            }
            if (nSimpleMA_TorF == null) {
            nSimpleMA_TorF = false;
            } else if (nSimpleMA_TorF == "T" || nSimpleMA_TorF == "t" || nSimpleMA_TorF == "true" ||
            nSimpleMA_TorF == "True") {
            nSimpleMA_TorF = true;
            } else if (nSimpleMA_TorF == "F" || nSimpleMA_TorF == "f" || nSimpleMA_TorF == "false" ||
            nSimpleMA_TorF == "False") {

            nSimpleMA_TorF = false;
            } else {
            nSimpleMA_TorF = false;
            }
            study = new MACDStudy(nFastLength, nSlowLength, nSmoothing, nPriceSource, eval
            (nSimpleMA_TorF));
            }

            if (nState == BARSTATE_NEWBAR) {
            if (vMACD != null)
            vMACD1 = vMACD;
            if (vSignal != null)
            vSignal1 = vSignal;
            vAlert = false;
            }
            vMACD = study.getValue(MACDStudy.MACD);
            if (vMACD == null)
            return;
            vSignal = study.getValue(MACDStudy.SIGNAL);
            if (vSignal == null)
            return;
            var vHist = study.getValue(MACDStudy.HIST);
            if (vHist == null)
            return;

            if (vAlert == false) {
            if (vMACD1 < vSignal1 && vMACD >= vSignal) { // crossing up
            vAlert = true;
            AlertCntr += 1;
            drawShapeRelative(0, vSignal, Shape.UPARROW, null, Color.yellow, Image.TOP | Image.ONTOP,
            "Alert" + AlertCntr);
            }
            if (vMACD1 > vSignal1 && vMACD <= vSignal) { // crossing down
            vAlert = true;
            AlertCntr += 1;
            drawShapeRelative(0, vSignal, Shape.DOWNARROW, null, Color.yellow, Image.BOTTOM |
            Image.ONTOP,
            "Alert" + AlertCntr);
            }
            } else {
            if ((vMACD1 < vSignal1 && vMACD < vSignal) || (vMACD1 > vSignal1 && vMACD > vSignal)) {
            vAlert = false;
            removeShape("Alert" + AlertCntr);
            }
            }

            return new Array(vHist, vSignal, vMACD);
            }

            Comment


            • #7
              Hello Brian,

              The outputs are actually the same. The difference is that MACDx-over.efs uses exponential moving average by default and MACDColorHist.efs uses simple moving average by default. If you go to "Edit Studies" and change the MA Type for MACDColorHist.efs to EMA, you will get matching outputs.

              Jason K.
              Project Manager
              eSignal - an Interactive Data company

              EFS KnowledgeBase
              JavaScript for EFS Video Series
              EFS Beginner Tutorial Series
              EFS Glossary
              Custom EFS Development Policy

              New User Orientation

              Comment


              • #8
                Im slowly learning this stuff and I appreciate all your help Jason.


                Thanks a million,
                Brian

                Comment


                • #9
                  Hi,
                  i'm using a version of this histogram color, but it produces weird result on tick charts: some tiimes it seems that the bars aren't colored corectly.

                  Maybe this indicator is not supposed to work on tick charts ?

                  Cordially,
                  Koros

                  Comment


                  • #10
                    example, attached file of a color macd to a 275 tick chart.

                    See how some lower bars are not red ?

                    Cordially,
                    Koros
                    Attached Files

                    Comment


                    • #11
                      Hello Koros,

                      The formula may be applied to a tick chart, but it may not produce very usable results depending on the interval you are using. Many histogram bars could be the same value as the previous bar if you are looking at intervals such at 10T or 50T. Try it on something like 200T or 1000T to get more useful results.
                      Jason K.
                      Project Manager
                      eSignal - an Interactive Data company

                      EFS KnowledgeBase
                      JavaScript for EFS Video Series
                      EFS Beginner Tutorial Series
                      EFS Glossary
                      Custom EFS Development Policy

                      New User Orientation

                      Comment


                      • #12
                        Hello Koros,

                        What symbol are you plotting in that chart?
                        Jason K.
                        Project Manager
                        eSignal - an Interactive Data company

                        EFS KnowledgeBase
                        JavaScript for EFS Video Series
                        EFS Beginner Tutorial Series
                        EFS Glossary
                        Custom EFS Development Policy

                        New User Orientation

                        Comment


                        • #13
                          AB H5....

                          Comment


                          • #14
                            Hello Koros,

                            You were right, there was an error in the coloring logic. It's now fixed and updated. Thanks for bringing this to our attention. Please download the new version below.

                            MACDColorHist.efs
                            Jason K.
                            Project Manager
                            eSignal - an Interactive Data company

                            EFS KnowledgeBase
                            JavaScript for EFS Video Series
                            EFS Beginner Tutorial Series
                            EFS Glossary
                            Custom EFS Development Policy

                            New User Orientation

                            Comment


                            • #15
                              You are welcome, thanks for the update.

                              Comment

                              Working...
                              X