Announcement

Collapse
No announcement yet.

MACDColorHist.efs

Collapse
X
 
  • Filter
  • Time
  • Show
Clear All
new posts

  • #16
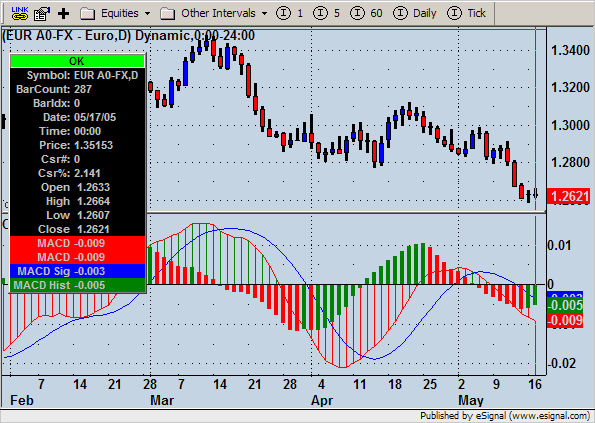
    This EFS displays very weird - ideas ??

    Not sure why this EFS is displaying so weird.
    Attached Files

    Comment


    • #17
      Found the problem - toFixed(4)

      Applied the fix that was listed below for a bloke that had the same problem with penny stocks to my EUR chart - changed "toFixed(2)" to value of (4) .

      Comment


      • #18
        Hello wolraad,

        Did you save the changes and then reload the formula? I made the same change and I'm seeing the following. Attach your version of the formula and I'll take a look at your code.

        Jason K.
        Project Manager
        eSignal - an Interactive Data company

        EFS KnowledgeBase
        JavaScript for EFS Video Series
        EFS Beginner Tutorial Series
        EFS Glossary
        Custom EFS Development Policy

        New User Orientation

        Comment


        • #19
          It works

          Thanks Jason,
          After my first post, I read the fix to change the "toFixed(2) with "toFixed(4) . This I did, and it works just fine - hence my 2nd post.

          WW.

          Comment


          • #20
            Hello wolraad,

            Thanks for pointing that out. I misread your post the first time. Good to hear you already had it fixed.
            Jason K.
            Project Manager
            eSignal - an Interactive Data company

            EFS KnowledgeBase
            JavaScript for EFS Video Series
            EFS Beginner Tutorial Series
            EFS Glossary
            Custom EFS Development Policy

            New User Orientation

            Comment


            • #21
              Color MACD Histogram

              Hi Jason,

              I just ran into your color MACD Histogram and applying it looks much smoother and very beautiful.

              Can you please explain what some numbers that appear in heading ( e.g. 32768, 255, 255 & 16711680 ) mean and how did you come up with them?

              They are unusually large and not something that one can imagine.
              How does this histogram & MACD differ from regular 12, 26, 9 parameters?

              Would you also please explain how do you use this histogram with variuos time frames including tick charts as well as Intraday minute charts & daily plus weekly charts?

              Thank You.
              Robert

              Comment


              • #22
                Robert
                Those numbers repesent the color settings for the plots which can be modified through Edit Studies. In the study title the settings for the MACD are the first 3 values shown and are 12, 26, 9 by default.
                Alex

                Comment


                • #23
                  Hi Alexis,

                  I see that in Basic MACD plot only signal line uses EMA & not the oscillator.

                  In original formula of MACD both Oscillator & Signal line uses EMA.

                  Why is this? It kind of makes you think that it is original MACD but it is not. Am I correct?

                  Also MACDColor uses SMA for both Oscillator & Signal line. Am I correct?

                  Robert

                  Comment


                  • #24
                    Robert
                    If you are referring to the MACD in Basic Studies then the Oscillator and the Signal line can be individually set to use either simple or exponential average.
                    MACDColorHist is by default set to use simple averages for both the Oscillator and the Signal lines. Through Edit Studies you can modify it to use an exponential average for the Oscillator.
                    If you want you can always add the optional parameter that will allow you to set also the Signal line to exponential. As an example of how to accomplish that you can use the builtinMACD.efs which you can find in the Builtin subfolder of Formulas.
                    Alex

                    Comment


                    • #25
                      Joe
                      Weighted MA is not an available average type with either the EFS1 or EFS2 versions of the MACD study.
                      The EFS2 MACD is based only on exponential averages whereas the EFS1 version includes the option to use simple or exponential for the MACD and/or the Signal lines.
                      You may want to send your suggestion/request for enhancement to [email protected]
                      Having said that it is relatively simple in EFS2 to create your own MACD study using whatever average type you may want. To do that you would first calculate the oscillator in a separate function then using efsInternal() you would call the oscillator into main and compute an average of that.
                      Alex

                      Comment


                      • #26
                        Thanks for the reply. I sent a suggestion in about weighted MACD, and they also referred me to efsInternal(), so I took a deep breath and jumped into it.

                        The attached is based on some other EFS2 scripts, like the MAofRSI, and help examples from the website.

                        Last night it gave me the picture I want, weighted MACD histogram with 5-sma, and with the colors, background, text and lines, with multiple TF capability. But today I have noticed some things that cause me concern.

                        I have 2 questions about it, and would appreciate your advice.

                        1. Looking at the Performance Monitor, it seems to make alot of calls, so it is very CPU intensive. Is there any way to reduce the number of internal calls? Maybe by bundlling the calls into a single efsInternal?

                        2. I am particularly interested in using the multiple time frame capability of EFS2 with this efs. For example, using it with a 5-min interval on a 1-min chart, or with 800t interval on 160t chart. This morning when the market opened, I had it with setComputeOnOpen(). But as time went on, I was finding the window was not updating properly when I was using a different time series than what was on the chart. This occurred on ES #F on both tick and time chart.

                        Then I removed the setComputeOnClose and it works great, except for the CPU usage.

                        So, if possible, I would like to make it more internally efficient, as well as make it amenable to ComputeOnClose. But I have run up against my EFS-understanding ceiling.

                        I would be grateful for any advice you might offer. Thanks. Joe.
                        Attached Files

                        Comment


                        • #27
                          Joe
                          Rather than try to correct your version of the script I would prefer to show you step by step how I would do it which I think you will find considerably more efficient.
                          The first step is to write the function that computes the MACD. The simplest method would be the following

                          PHP Code:
                          function calcMACD(Short,Long,Source){
                           
                              return 
                          wma(Short,Source) - wma(Long,Source);

                          However we are retrieving the series for each wma() on every tick which is something we do not need at this stage. A more efficient way is to declare the series only once and then retrieve/use their values to compute the oscillator

                          PHP Code:
                          var xShortMA null;
                          var 
                          xLongMA null;
                           
                          function 
                          calcMACD(Short,Long,Source){
                           
                              if(
                          xShortMA==nullxShortMA wma(Short,Source);
                              if(
                          xLongMA==nullxLongMA wma(Long,Source);
                           
                              var 
                          nShortMA xShortMA.getValue(0);
                              var 
                          nLongMA xLongMA.getValue(0);
                           
                              if(
                          nShortMA==null || nLongMA==null)
                              return;
                           
                              return (
                          nShortMA-nLongMA);

                          Now that we have computed the oscillator we create another function that will compute both the Signal line and the Histogram. Again here is the more direct but less efficient way first.

                          PHP Code:
                          function calcSig(Short,Long,Smoothing,Source){
                           
                              var 
                          MACD efsInternal("calcMACD",Short,Long,Source);
                              var 
                          Sig  wma(Smoothing,MACD);
                           
                              return new Array (
                          MACDSig, (MACD-Sig));

                          The considerations made above regarding efficiency are applicable also in this case. We still do not need to return any series so we replicate the same construct using the values

                          PHP Code:
                          var xMACD null;
                          var 
                          xSig null;
                           
                          function 
                          calcSig(Short,Long,Smoothing,Source){
                           
                              if(
                          xMACD==nullxMACD efsInternal("calcMACD",Short,Long,Source);
                              if(
                          xSig==nullxSig wma(Smoothing,xMACD);
                           
                              var 
                          nMACD xMACD.getValue(0);
                              var 
                          nSig xSig.getValue(0);
                           
                              if(
                          nMACD==null || nSig==null)
                              return;
                           
                              return new Array (
                          nMACDnSig, (nMACD-nSig));

                          At this point we only need to call the calcSig() function once from main() using efsInternal() and then by using getSeries() we can retrieve the individual series to be plotted. In this last example I will not replicate both methods (ie the less efficient and the more efficient one) as I think that issue is clear at this point.

                          PHP Code:
                          var bInit false
                          var myMACD null;
                           
                          function 
                          main(){
                              
                              if(
                          bInit==false){
                                  
                          //whatever code will be required for Symbol, Interval, etc as in your efs
                                  
                          myMACD efsInternal("calcSig"Short,Long,Smoothing,Source);
                                  
                          bInit=true;
                              }
                           
                              return new Array (
                          getSeries(myMACD,0), getSeries(myMACD,1), getSeries(myMACD,2));

                          If you prefer a different (and perhaps easier to understand) arrangement it could also be written this way and it would be just as efficient.

                          PHP Code:
                          var bInit=false;
                          var 
                          temp null;
                          var 
                          myMACD null;
                          var 
                          mySig null;
                          var 
                          myHist null;
                           
                          function 
                          main(){
                              
                              if(
                          bInit==false){
                                  
                          //whatever code will be required for Symbol, Interval, etc as in your efs
                                  
                          temp efsInternal("calcSig"Short,Long,Smoothing,Source);
                                  
                          myMACD =  getSeries(temp,0);   
                                  
                          mySig getSeries(temp,1);
                                  
                          myHist getSeries(temp,2);
                                  
                          bInit=true;
                              }
                           
                              return new Array (
                          getSeries(myMACD), getSeries(mySig), getSeries(myHist));

                          All that is necessary to complete the script at this stage is to add preMain() and the ancillary code required to define the parameters such as FunctionParameters, etc
                          Hope this helps
                          Alex

                          Comment


                          • #28
                            Thanks to both of you for the replies. This gives me alot to work with and think about. Alex, you are right about not re-writing my code - what you did gives me a great foundation to work from.

                            Thanks very much. Joe.

                            Comment


                            • #29
                              Alexis, your posting helped me re-write the weighted MACD and understand the structure much better than before. Thanks much.

                              Since I anticipate other Members will use your post as guidance in the future, I wish to point out a very minor typo.

                              In the 4th code bax (efficient calcSig) there is a line:

                              var nSig = nSig.getValue(0);

                              but it should read:

                              var nSig = xSig.getValue(0);

                              Again, thank you very much. Joe.

                              Comment


                              • #30
                                Joe
                                You are most welcome and thank you for pointing out the typo which I have now corrected
                                Alex

                                Comment

                                Working...
                                X