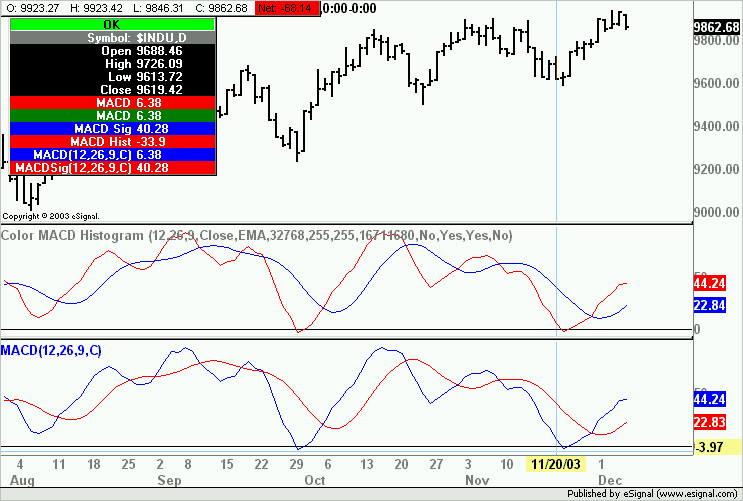
Announcement

Collapse
No announcement yet.

MACDColorHist.efs - Modifications

Collapse
X
 
  • Filter
  • Time
  • Show
Clear All
new posts

  • #16
    Slider Problem

    Jason,

    I reported this Slider Problem a few weeks ago and it's generalized i.e. not just this particular EFS. Would you please pass this on to Development in case they didn't catch this before 7.5 went Gold.

    Thanks,
    Bob A.

    Comment


    • #17
      how come plot from MACDColorHist diff from basic MACD given same parameter, (I prefere plot from MACDColorHist tho)
      Attached Files

      Comment


      • #18
        nkhoi
        As far as I can see in your image the parameters are not the same. In the MACDColorHist you are using SMA for the Oscillator whereas the basic MACD uses EMA by default.
        If you change MACDColorHist option to EMA you should have the same plots (see image)
        Alex

        Comment


        • #19
          alex, thank.

          Comment


          • #20
            macdcolorhist2

            Hi Jason,

            In the above file, is it possible to add feature, where I can adjust the thickness of drop line and signal line.

            Thanks

            Comment


            • #21
              Hello bandraguy,

              Yes this is possible. To make the thickness a formula parameter you can use the FunctionParameter Object. You would pass the formula parameter variables to the setDefaultBarThickness() and setDefaultBarFgColor() functions. To see more code examples that use this object, check out the formulas in your \eSignal\Formulas\EFS 2 Custom\ folder. Also check out section 4 in Tutorial 3, which is dedicated to this process.
              Jason K.
              Project Manager
              eSignal - an Interactive Data company

              EFS KnowledgeBase
              JavaScript for EFS Video Series
              EFS Beginner Tutorial Series
              EFS Glossary
              Custom EFS Development Policy

              New User Orientation

              Comment


              • #22
                MACDColorHist2

                Hi Jason & Alexis,

                I tried to add additional function parameter, to have an option to change the line thickness, I kept getting lots of error messages.

                Instead, I added the following lines in the preMain,

                function preMain() {
                setStudyTitle("Color MACD Histogram2 ");
                setCursorLabelName("MACD", 0);
                setCursorLabelName("MACD", 1);
                setCursorLabelName("MACD Sig", 2);
                setCursorLabelName("MACD Hist", 3);
                setDefaultBarFgColor(Color.blue, 0);
                setDefaultBarFgColor(Color.blue, 1);
                setDefaultBarFgColor(Color.red, 2);
                setDefaultBarFgColor(Color.magenta, 3);

                /* Begin Changes */
                setDefaultBarThickness(2, 0);
                setDefaultBarThickness(2, 2);
                /* End Changes */

                setDefaultBarThickness(4, 3);
                setPlotType(PLOTTYPE_LINE, 0);
                setPlotType(PLOTTYPE_HISTOGRAM, 1);
                setPlotType(PLOTTYPE_LINE, 2);
                setPlotType(PLOTTYPE_HISTOGRAM, 3);

                So far, this gives me the desired results. Please let me know, is this the right way to do it.

                Thanks

                Comment


                • #23
                  Hello bandraguy,

                  You can certainly use the preMain() code as you've posted, but that does not create a formula parameter that can be changed through the Edit Studies option.

                  What were the specific errors you were receiving? If you post that code I'll take a look at it and help you correct it.
                  Jason K.
                  Project Manager
                  eSignal - an Interactive Data company

                  EFS KnowledgeBase
                  JavaScript for EFS Video Series
                  EFS Beginner Tutorial Series
                  EFS Glossary
                  Custom EFS Development Policy

                  New User Orientation

                  Comment


                  • #24
                    To make macd and signal line thickness a formula parameter, I could not find FunctionParameter.THICKNESS or FunctionParameter.SIZE, just like FuntionParameter.COLOR or STRING. Unless, this can only be done in preMain when defining "MACD".

                    Thanks,

                    bandraguy

                    Comment


                    • #25
                      Hello bandraguy,

                      The function parameter types are the types of parameters that can be used in the collection of EFS functions. These types are limited to Number, String, Color and Boolean.

                      The line thickness for a specific series can be set by the EFS function, setDefaultBarThickness(nThickness [, nSeriesIndex]). Within the reference article you can see that the two parameters this function is expecting are integers. Integers are numbers. Therefore, the function parameter type that you will use to pass a value for the thickness will need to be FunctionParameter.NUMBER.

                      Take a look at the code for Entrop.efs. This formula uses the .NUMBER type to set the thickness for the plotted series. Incorporate the same process used for the "nThick" function parameter into your formula. If you run into any problems, please post your code.
                      Jason K.
                      Project Manager
                      eSignal - an Interactive Data company

                      EFS KnowledgeBase
                      JavaScript for EFS Video Series
                      EFS Beginner Tutorial Series
                      EFS Glossary
                      Custom EFS Development Policy

                      New User Orientation

                      Comment


                      • #26
                        Hi Jason,

                        I created new function parameter at the end of previous function parameters. I tried to zero out the variable 'nthick' along with the other variables. Towards the end of the code, tried to have a value in variable 'nthick' and got no result.

                        Can you please help me out.

                        Thanks,

                        bandraguy
                        Attached Files

                        Comment


                        • #27
                          Hello bandraguy,

                          The first thing you need to do is correct your syntax errors. In the EFS Editor click on the Syntax check icon, which is the check mark icon.

                          The first error reported is on line 159. This error is indicating that you are missing the opening brace ( { ) for the if statement on line 157. It should look like below.


                          After making this correction you will need to check your other if statements for the same error. In JavaScript, each opening brace, {, needs to have a corresponding closing brace, }. In this case I see one extra close brace that is not needed on line 156. Remove that one.

                          The next thing you need to do is correct your case for the setDefaultBarThickness() function. JavaScript and EFS are case sensitive. When you are not sure about the case, check the reference article in the EFS KB. Another hint that your case is incorrect while your writing code is when the keyword's color does not change to blue. If the font color of the function name remains black, you've likely misspelled the function name or missed one or more cases.


                          After making these corrections, you should not have anymore syntax errors. Verify this by running the syntax checker again. It will report "No Syntax Errors" to the formula output window.

                          Now, at this point your formula can be applied to a chart. However, your new formula parameter will have no affect on the chart. This is due to a logic error in your code. Currently you are calling the setDefaultBarThickness() function inside a conditional statement that requires nFast to be equal to null. This will always be false because nFast is set to 12 by default, see preMain(). What you can do is delete the conditional statement, as it is not necessary. Then move the function call to line 124, which is just below the other setDefaultxxx function calls. This code block is inside a conditional statement that checks for the value of "study" to be null, which occurs once at the beginning of the formula processing. This type of routine is referred to as an initialization routine. In other formulas you'll see in the forums, look for the "bInit" or "bEdit" variable, which is a Boolean flag used to create an initialization routine.

                          This should get your code working. If you have any trouble, please post your updated code along with details.
                          Jason K.
                          Project Manager
                          eSignal - an Interactive Data company

                          EFS KnowledgeBase
                          JavaScript for EFS Video Series
                          EFS Beginner Tutorial Series
                          EFS Glossary
                          Custom EFS Development Policy

                          New User Orientation

                          Comment


                          • #28
                            Hi Jason,

                            It finally worked, see attached file. Thanks to your detailed information about the placement and syntax of the code.

                            From the code below, how does the program references " ,0 " and " ,2 " to the 'macd' study lines and not any other lines on the chart?

                            124 setDefaultBarThickness(nthick,0);
                            125 setDefaultBarThickness(nthick,2);

                            I appreciate your help.

                            bandraguy
                            Attached Files

                            Comment


                            • #29
                              Hello bandraguy,

                              That number is the index number for the series that are returned by main. When a formula returns an array to plot multiple indicators, each series corresponds to an index from that array. The first series in the array has an index of 0. The second series in the array has an index of 1 and so on.

                              The return array in your formula,

                              return new Array(vMACD, vMACD, vSig, vHdisplay);

                              The first vMACD is index 0.
                              The second vMACD is index 1.
                              vSig is index 2.
                              vHdisplay is index 3.

                              Therefore, the following two lines of code,

                              setDefaultBarThickness(nthick,0);
                              setDefaultBarThickness(nthick,2);

                              set the thickness for the first vMACD series (i.e. index 0) and the third series, vSig (i.e. index 2). Hope this helps.
                              Jason K.
                              Project Manager
                              eSignal - an Interactive Data company

                              EFS KnowledgeBase
                              JavaScript for EFS Video Series
                              EFS Beginner Tutorial Series
                              EFS Glossary
                              Custom EFS Development Policy

                              New User Orientation

                              Comment


                              • #30
                                I am new to eSignal and I am looking for a MACD indicator that has coloured histogram bars, but I want the bars to be green above the zero line and red below the zero line, is there one in existence or can the one in this thread be altered ?

                                Many thanks.

                                Anthony
                                Last edited by anthonywood; 10-04-2012, 01:37 AM.

                                Comment

                                Working...
                                X