Announcement

Collapse
No announcement yet.

Automatic intraday supply and demand line

Collapse
This topic is closed.
X
X
 
  • Filter
  • Time
  • Show
Clear All
new posts

  • Automatic intraday supply and demand line

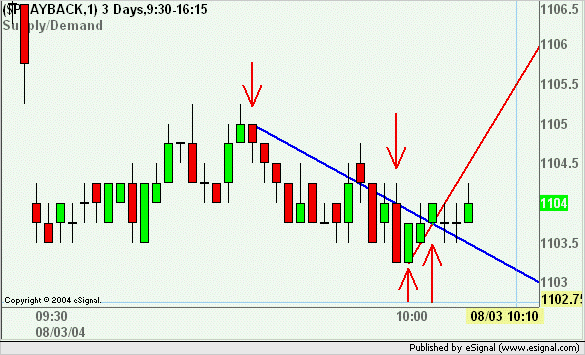
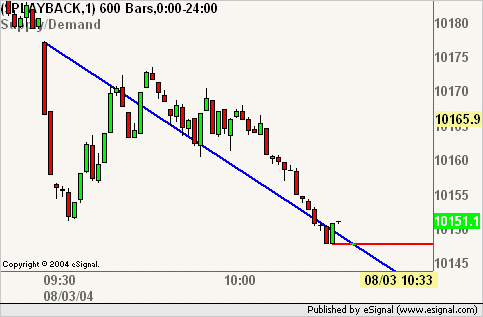
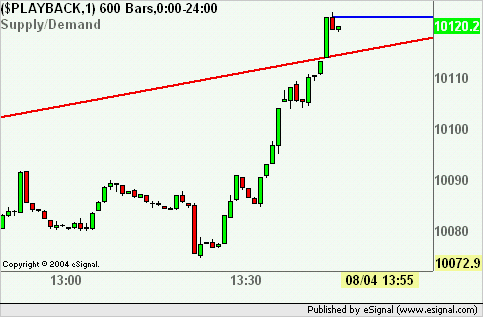
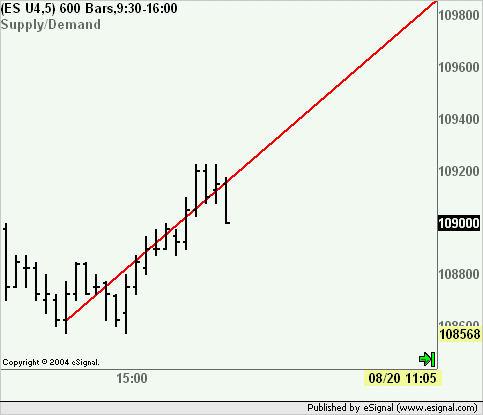
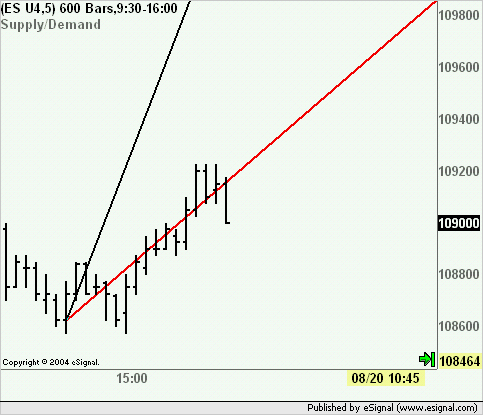
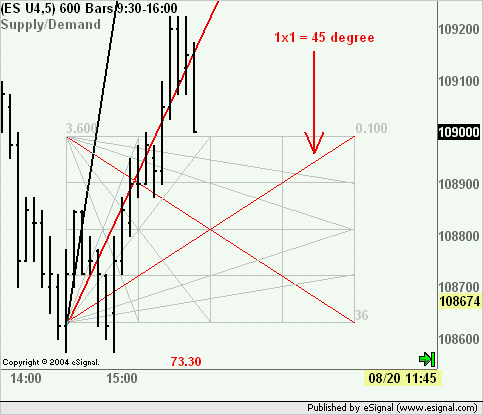
    I need an intraday pricestudy that plots a extended (sloping) line connecting the opening price of only fully completed candles.
    The study will draw two lines:

    A supply Line:
    connects highest downcandle with the last completed downcandle. If the highest downcandle is also the last downcandle, then only draw a horizontal line at this candle's opening price;

    A demand line:
    connects lowest upcandle with the last completed upcandle. If the lowest upcandle is also the last upcandle, then only draw a horizontal line at this candle's opening price;

    Does anybody has this efs already? If not, can this be build easily? suggestions and advice on pitfalls is appreciated.

    Sincere,
    Clyde
    Last edited by contrakt; 08-14-2004, 11:38 AM.

  • #2
    Clyde
    The attached efs should do what you want.
    The efs is programmed to compute on close of bar only and will plot two extended lines (rays), a blue one from the Open of the highest down bar to the Open of the latest down bar and a red one from the Open of the lowest up bar to the Open of the most current up bar


    In the sample image above you can see the efs in action. Note that the red line does not go to the very last Open because the efs is set to compute on close only. This will happen on the first bar of the new day after which on the second bar it will begin drawing the lines for the new day.
    When the highest down bar/lowest up bar is also the most recent down/up bar then the ray plots horizontally. However because of a known issue with rays having the same start/end coordinates the ray extends to the left rather than to the right. eSignal is aware of this issue and has it on the list of items to be fixed.
    Alex
    Attached Files

    Comment


    • #3
      Alexis, for me you are

      The Hero of the Day

      After looking at your code, as an efsjunior, I guess the closing of a last candle if open=close, will not move the supply and demand line at all?

      Clyde
      Last edited by contrakt; 08-15-2004, 09:14 AM.

      Comment


      • #4
        Clyde
        The pleasure is mine and thank you for the compliment
        Alex

        Comment


        • #5
          Clyde

          I guess the closing of a last candle if open=close, will not move the supply and demand line at all?

          It should ignore bars where the Close is equal to the Open.


          In the image above you can see that the rays remain anchored to the last corresponding up/down candles which are followed by two bars with equal Open/Close.
          Alex

          Comment


          • #6
            The attached revision of the efs resolves the issue of the rays plotting to the left rather than to the right when the highest down candle or the lowest up candle are also the most current down/up candle.
            Alex


            Attached Files

            Comment


            • #7
              Alexis,

              Thanks you for the improvement of the tool. I was a out of town so my reaction is a bit delayed.

              I had some time to reflect on possible nuances and have started to figure out an entry/exit/trade management scheme and the timeframe of candles considering the vehicels I trade.

              Could you calculate the angle of those lines? This would complete this tool for me. The supply line would range between zero for flat and a very negative number for strong supply. Demand would range between zero and a very positive number for strong demand.

              Clyde

              Comment


              • #8
                Clyde
                The first issue to resolve is what constitutes an angle in a price chart.
                The consensus is that a rise over run of 1 point over 1 unit of time is equal to a 45 degree angle. Aside from the fact that IMHO this is a subjective assignment since the two units of measure have no meaningful relationship it does not take into consideration the price scale of the chart, its compression, etc.
                Things are further complicated by the visual perception that we have of the angle of a line drawn on a chart when viewing only a segment of that chart.
                Here is an example of what I am trying to suggest.

                In the following image what is the angle of the Demand line drawn on this chart?


                From a purely visual perspective it looks like a 45 degree angle.
                In the next image you will see another line drawn in black on the chart which is the result of a 1:1 rise over run calculation. What this line does is show you where the 45 degree angle is if we assume a 1 point rise over 1 bar


                As you can see the 45 degree line is certainly not where our eyes would expect to find it. Irrespective what reading would we get of the angle of the Demand line if we were to apply the appropriate calculations? The value of the calculated angle can be seen in the next image centered near the bottom of the chart.


                If I now AutoScale the very same chart does that look like an 18.43 degree angle?


                Where would we expect to see the 45 degree line in the last chart? To do that I will use a Gann Box which allows me to create a square relative to the scale of the chart


                Once again there is a considerable disparity between what we perceive and what is calculated. Things get even more out of line if we now apply this efs to the same security but on a different interval or to a different security that trades at around 10 dollars for example or to the Dow which is at around 10,000.
                We can compensate for this by applying a coefficient based on the price of the security. If you look at the last chart you will see that the Gann Box does provide some indication of what the coefficient needs to be.
                So, if in the same efs I now apply that coefficient to the calculation of the angle this is the result I get


                The value of the angle now matches our perception but is clearly incorrect if one assumes a rise over run of 1:1 (shown by the black line)

                In light of the above the attached efs will calculate the value of the angle by default in "raw" mode (ie without any coefficient). However it is possible to apply a coefficient in Edit Studies to adjust the calculations for the angle to the underlying price. There are 4 predefined coefficients (1, 10, 100, 1000) and an empty one for any other value one may wish to use (default is 1). The coefficients are inverse to price ie the higher the price the lower the required coefficient.
                I left in the efs (but commented it out) the command that plots the 45 degree line shown in the prior images

                In the image below you can see the efs in action with a coeffiecient applied to adjust the "angle" to the underlying symbol. Note that the Gann Box is not plotted by the efs and was manually added to verify the correctness of the "visual" angle of 44.48 degrees.


                Based on what I have tried to explain in this post and because of the subjectiveness of the issues involved I will not be developing this efs any further.
                Alex
                Attached Files

                Comment


                • #9
                  Alexis,

                  Your work is very mutch appreciated. Understood your arguments.

                  Thank you,
                  Clyde

                  Comment

                  Working...
                  X