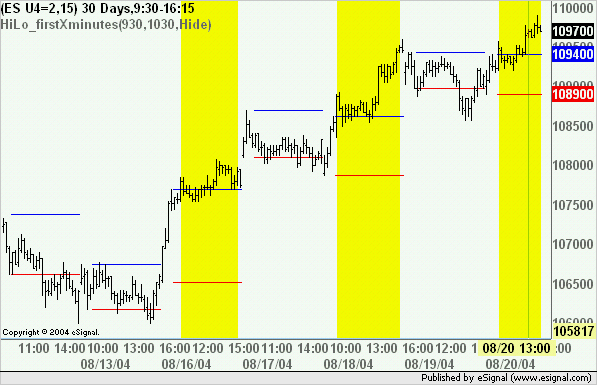
I'm trying to learn more about how to access specific time bars in an EFS, but I'm a bit lost. I was hoping someone could help me with how to construct the following:
I want to look at the opening 60min bar of any given day, and ideally plot two lines on that day, one for the opening 60min high and one for the opening 60min low. Ultimately I want to experiment with the backtester by using breaks of those highs or lows as long/short signals.
I've seen the pivot studies that do draw the kind of lines I'm looking for, but I don't udnerstand the EFS language enough to pull them apart and modify one to work how I want it to. I saw that there is a getHour() function or something like that, but I am unclear on how to use it and couldn't find anything in the help file about doing so.
Anyone care to help?
Thanks!
Jonathan

Comment