Announcement

Collapse
No announcement yet.

Need help with simple educational study...

Collapse
X
 
  • Filter
  • Time
  • Show
Clear All
new posts

  • Need help with simple educational study...

    I'm trying to learn more about how to access specific time bars in an EFS, but I'm a bit lost. I was hoping someone could help me with how to construct the following:

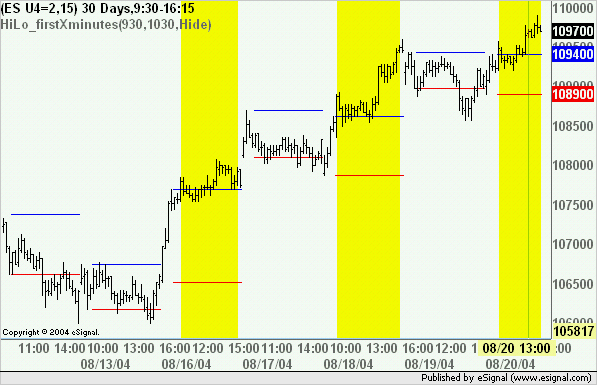
    I want to look at the opening 60min bar of any given day, and ideally plot two lines on that day, one for the opening 60min high and one for the opening 60min low. Ultimately I want to experiment with the backtester by using breaks of those highs or lows as long/short signals.

    I've seen the pivot studies that do draw the kind of lines I'm looking for, but I don't udnerstand the EFS language enough to pull them apart and modify one to work how I want it to. I saw that there is a getHour() function or something like that, but I am unclear on how to use it and couldn't find anything in the help file about doing so.

    Anyone care to help?

    Thanks!

    Jonathan
  • #2
    Jonathan
    You may want to look at the efs attached to this post
    Alex

    Comment


    • #3
      As usual, Alex to the rescue. THanks yet again! Funny thing is, I saw that thread once before but wasn't lokoing for such a solution at that time, and forgot about it.

      Now, another silly question... I want to change the colors of the lines as well as thickness, but I can't figure out where to find a list of "valid" color choices! Also how does one control thickness of lines within the EFS?

      One last minor aesthetic thing... I notice it draws the lowest low or highest high up to any given bar until the first hour is over, at which point it just continues the same last lines. Is there a way to make it NOT draw at all in the first hour? Would make things neater.

      Thanks as always!!

      J

      Comment


      • #4
        Jonathan
        You can find a list of color choices here
        However you can create your own colors by using RGB values. To find out what the corresponding RGB value is for a given color use the RGB Color Calculator that Chris Kryza has made available here
        Alex

        Comment


        • #5
          Jonathan
          To vary the thickness of the lines add the following in preMain()
          setDefaultBarThickness(1,0);
          setDefaultBarThickness(1,1);
          The first value in the parenthesis changes the thickness the second one assigns the command to the appropriate element in the return array
          I will look into the possibility of modifying the efs so that it either does not plot in the first nn minutes or that it adjusts the existing plots. Not sure as to when I can get to doing it though.
          Alex

          Comment


          • #6
            Great, thanks for that list! What about making the lines thicker? I can't just use Edit Studies as that will override the colors too...

            J

            Comment


            • #7
              Oops... we posted at the same time. =) Thanks!

              J

              Comment


              • #8
                Jonathan
                In the original thread (see link in earlier message) I have posted an updated version of the efs that now includes the option to show or hide the High/Low lines during the first nn minutes of trading.
                Alex

                Comment


                • #9
                  Great Alex, thanks so much as always!

                  J

                  Comment


                  • #10
                    OK, more questions...

                    I'm trying to get a feel for how to plot signals on a chart. So using my previous simple 60min breakout example, I want to do the following, but can't get there with the Wizard:

                    On a 15min chart, when the close of the previous bar is greater than the high of the first 60min bar, go long (eventually I want to play with adding a trailing stop too).

                    The same in reverse for short... if the close of the previous 15min bar is lower than the first 60min bar low, go short.

                    Maybe this is too complex for the wizard, and I'm afraid I'm not much of a programmer, so I don't know how to code this by hand from scratch using EFS. Any pointers or help is appreciated.

                    It seems that this should be quite simple and I could learn a lot by getting it to work, but I'm stumped.

                    Thanks everyone...

                    J

                    Comment


                    • #11
                      Jonathan
                      I doubt it can be done with the Formula Wizard
                      Attached you can find an example of the strategy applied to the Hilo_firstXminutes.efs
                      In the example the strategy waits for the first bar to close above the high of the first nn minutes and goes long at the open of the bar that follows. If long at 16:00 it closes the trade on the Close. Lastly it paints the background in yellow when long.
                      This is just to show you one way of accomplishing this.
                      Alex

                      Attached Files

                      Comment


                      • #12
                        Hi again Alex, thanks so much for posting this! I am going to pick it apart to learn from it...

                        There appears to be one problem though. On my system, on any chart, all I get is everything painted yellow. It goes long at the first bar of my chart and stays long for all eternity. Any idea why?

                        Thanks!

                        Jonathan

                        Comment


                        • #13
                          Jonathan
                          A guess would be that you don't have a bar time stamped 16:00 and so the first trade never gets closed.
                          If that is the case adjust the value of 1600 in line 99 of the efs with one that matches your market end time
                          Alex

                          Comment

                          Working...
                          X