Announcement

Collapse
No announcement yet.

Alternative Fair Value - Itai Schweitzer

Collapse
X
 
  • Filter
  • Time
  • Show
Clear All
new posts

  • Alternative Fair Value - Itai Schweitzer

    Good morning Alex and all.

    Could you help coding the following CCI based Fair Value.

    My Idea here is to trade based on a reference, which is more objective than price.

    *"The Code - "
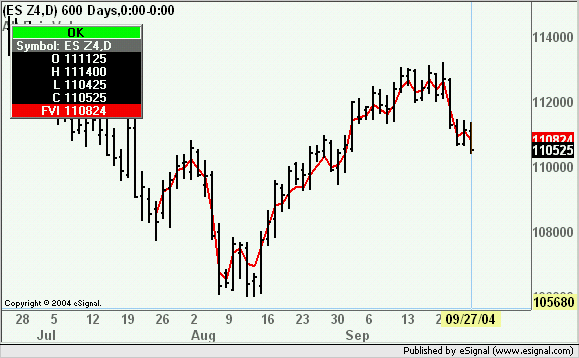
    (((CCI(close,14) + 200) / 400) * (Bollinger Up Band - Bollinger Lower Band)) + Bollinger Lower Band.

    ***bollinger also close, 14 and 2 STD

    This should plot a type of MA on the chart where prices "should" be.

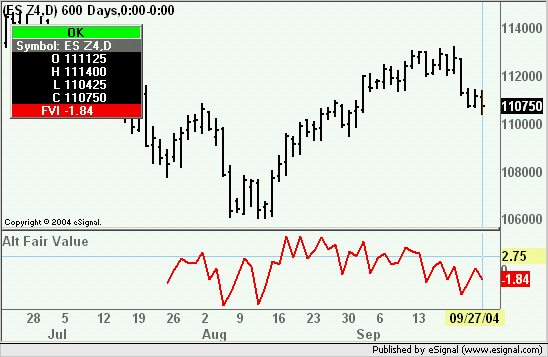
    In addition, this indicator has a lower pane component, which plots a histogram (Positive Negative), which is based on the difference between the price and the original indicator.

    So if "The code" is Value1 (sorry I’m used to TS) then the lower pain indicator is Close(or last price) - Value1.
    For this histogram, It is imperative that we get the following visual effect - It stretches up and down as price fluctuate away from price but doesn’t necessary close as far as it was in its most extreme level during the interval so it is important to make this histogram leave a Tail at its extremes so that one can see where it reached regardless its close for the interval. The closing value will appear as a horizontal gauge or maybe, A candle like histogram with a Body and tail positive and negative (look @ the visual of the Bid/AskVolume indicator available in these forums some where) ..


    It works on any time frame Futures and commodities.

    I use it to position my self for entry and alerts for over extreme intra bar levels.

    I think ppl which will Back Test this will find this extremely profitable if used correctly.

    Thank you.
    Itai Schweitzer
    SEP 27 / 2004

  • #2
    Itai
    Can you post the TS2k code so I can compare the results
    Alex

    Comment


    • #3
      FV - Itai TS

      Inputs:
      Length(14), Price(close), STD(2);

      Value1 = CCI(length);
      Value2 = BollingerBand(close,14,2);
      Value3 = BollingerBand(close,14,-2);

      Value4 = (Value1 + 200) / 400;
      Value5 = (Value4 * (Value2 - Value3)) + Value3;

      Plot1 (Value5, "FVI");

      ___________________________________

      Second Indicator lower pane -

      Same code as above but -

      Plot1 (close - value5);

      (the Tail manipulation I am unable to post).

      Thanks
      Itai Schweitzer
      SEP 27 / 2004

      Comment


      • #4
        Itai
        The attached efs will compute and plot the FVI as a price study.
        Note that for the CCI the source used is HLC/3 as that is the default setting in TS2k
        Alex

        Attached Files

        Comment


        • #5
          Could you please post the aditional part of this?

          The lower indicator is the tradable part of this weather to Scalp extremes or to Identify flow..


          With out it, this is incomplete.

          Thank you very much.
          Itai

          Comment


          • #6
            Itai
            Attached is the indicator as per the TS code you posted
            As for the "tails" the amount of programming required is a lot more than I am available to do.
            Alex

            Attached Files

            Comment


            • #7
              Alex thank you - help with the Tails

              If any 1 ells could do the following I think we will all be greatfull.

              The atached file shows the desired visual for these tails.
              The would be then plotted as a histogram with a 0 mid line.

              Thank you Alex.
              Thank you all.

              Itai Schweitzer.
              Attached Files

              Comment


              • #8
                How to change to histogram?

                In TS one can right click on any indicator and change from line to histogram etc' ..
                Hot to I change a lower pane indicator from line to "0" based histogram ?

                Thanks
                Itai

                Comment


                • #9
                  Itai
                  In the attached revision I have included the option to plot the indicator as a line or as a histogram.
                  Alex
                  Attached Files

                  Comment


                  • #10
                    Normalizing to any MKT

                    Deal Alex.
                    Thank you very much for the help.

                    Using the indicator we just did on NQ DAx and ES , I think that the best way of calculating the Lower pane indicator is by comparing the Price position within the BB and the CCI position with the 400 point range.

                    i.e. %B of Price - %B of CCI.
                    Adding to this and over bought over sold @ +25 and -25.

                    This will enable new users seeing its power in any MKT without the need to learn each MKT threshold.


                    Thank you again,
                    you make this all worth while.

                    Itai Schweitzer

                    Comment


                    • #11
                      Correction - !

                      Sorry for that -
                      Compare %B of price within BB and %B of Indicator with BB aswell.

                      comparing both price and indicator position within the bollinger Bands will reveal the STD diff (or the lower indicator) for any MKT.

                      thanks
                      Itai

                      Comment


                      • #12
                        Itai
                        You can easily do that by copying over the expression that computes the %B from the Percent B.efs that can be found in the Bollinger subfolder of Formulas.
                        Then replace the variables in that expression with the ones used in the Alt fair value(indicator)2.efs. For example to calculate the %B of the indicator you would use Value5 in place of Last, Value2 in place of Upper, etc.
                        Alex

                        Comment


                        • #13
                          Tthank you

                          Ill try this and post my result.

                          Comment

                          Working...
                          X