Good morning Alex and all.
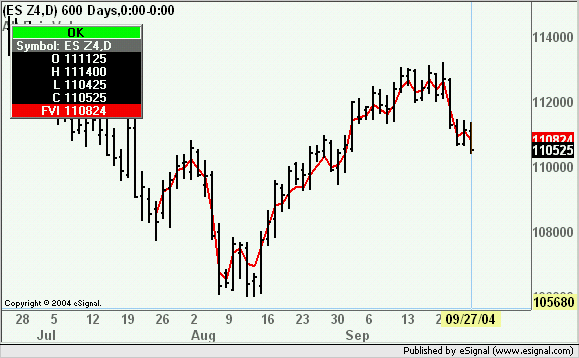
Could you help coding the following CCI based Fair Value.
My Idea here is to trade based on a reference, which is more objective than price.
*"The Code - "
(((CCI(close,14) + 200) / 400) * (Bollinger Up Band - Bollinger Lower Band)) + Bollinger Lower Band.
***bollinger also close, 14 and 2 STD
This should plot a type of MA on the chart where prices "should" be.
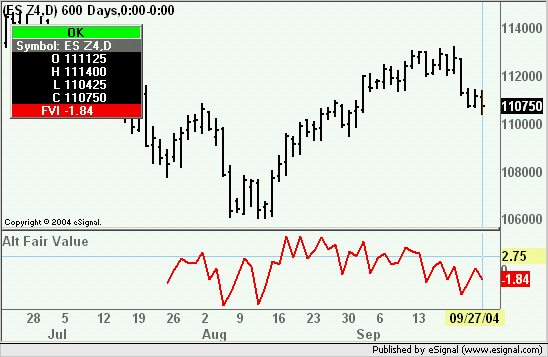
In addition, this indicator has a lower pane component, which plots a histogram (Positive Negative), which is based on the difference between the price and the original indicator.
So if "The code" is Value1 (sorry I’m used to TS) then the lower pain indicator is Close(or last price) - Value1.
For this histogram, It is imperative that we get the following visual effect - It stretches up and down as price fluctuate away from price but doesn’t necessary close as far as it was in its most extreme level during the interval so it is important to make this histogram leave a Tail at its extremes so that one can see where it reached regardless its close for the interval. The closing value will appear as a horizontal gauge or maybe, A candle like histogram with a Body and tail positive and negative (look @ the visual of the Bid/AskVolume indicator available in these forums some where) ..
It works on any time frame Futures and commodities.
I use it to position my self for entry and alerts for over extreme intra bar levels.
I think ppl which will Back Test this will find this extremely profitable if used correctly.
Thank you.
Itai Schweitzer
SEP 27 / 2004


Comment