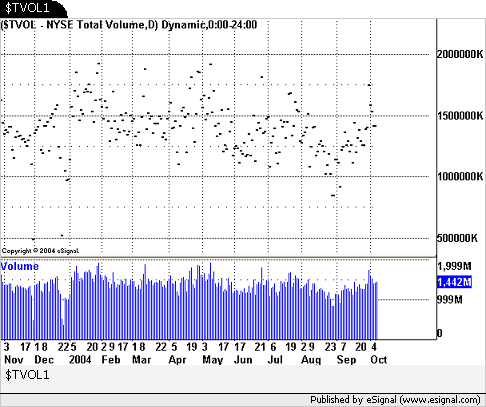
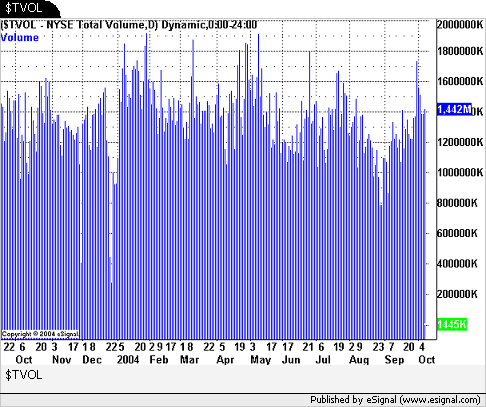
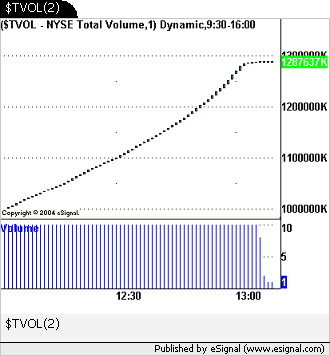
I am posting a shot of a very useful screen shot of a TS volume chart for the NYSE. I know we can use the symbol $TVOL for this volume BUT I cant find a way to get a useful chart with it. The nice thing about the TS chart is the different colors - so that you can easily compare 2 different times of reference - like- today at 9:00am and yesterday at 9:00am. With out bracketing the different times of the day in different colors - it makes it very difficult to easily see the comparisons.
Any help with this will be greatly appreciated.
gdavi68
Any help with this will be greatly appreciated.
gdavi68


Comment