Announcement

Collapse
No announcement yet.

cci histogram red below 0 line blue above 0 line

Collapse
X
 
  • Filter
  • Time
  • Show
Clear All
new posts

  • cci histogram red below 0 line blue above 0 line

    Hi-

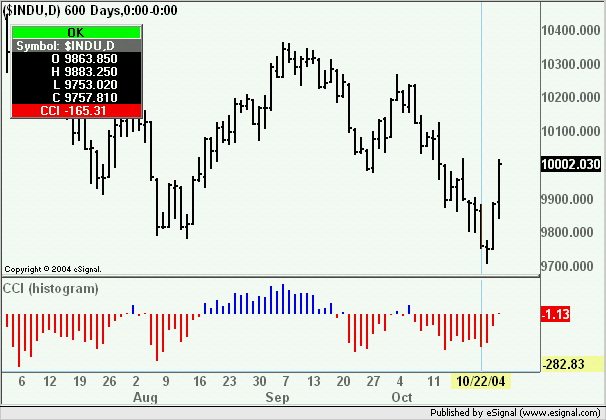
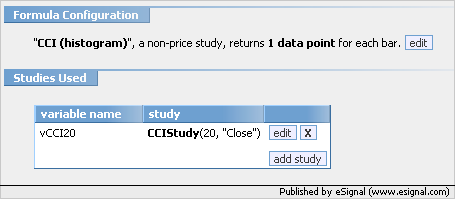
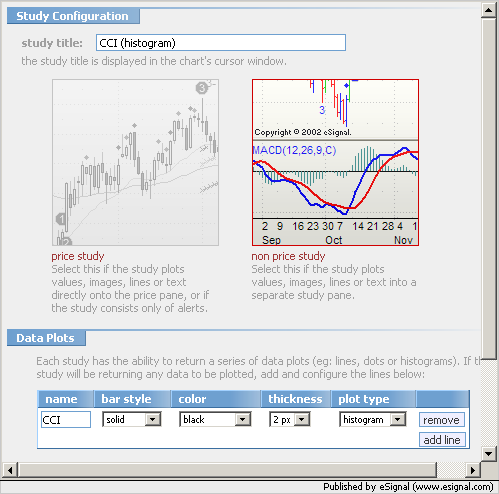
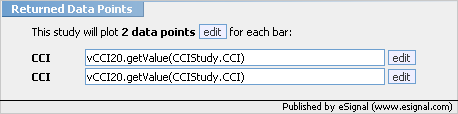
    Does anyone know if there is an efs file for cci that will color a cci histogram red below 0 line, blue above 0 line?

    I am using the various cci studies and (due to my lack of knowledge in writing formulas. And I have tried to change the formulas with no success) they are always blue. It would be easier to read with 2 colors.

    thanks,

    jeff

    jeffd

  • #2
    jeff
    Here is an example written using only the Formula Wizard
    Alex

    Attached Files

    Comment


    • #3
      this is great

      I really appreciate it

      thanks for the quick response

      jeff
      jeffd

      Comment


      • #4
        color change

        I was wondering how I go about changing the blue color to a lime color and adding a normal CCI to it (so it looks like a normal CCI with a histogram inside it). Bruce

        Comment


        • #5
          Bruce
          That efs was created with the Formula Wizard which you can use to easily change the color of the CCI from blue to lime (the color is set in the first condition ie Set1).
          As to adding a line you can do that with the Formula Wizard also. Add a second Data Plot, set the Plot Type to Line and in the Returned Data Points insert a duplicate of the first Returned Data Point.
          Alex

          Comment


          • #6
            I figured the color out but couldn't figure out the adding of a CCI line so, I just added another CCI study and overlaid them. I'd prefer to have it as one study but its OK with 2 studies. Thanks Bruce

            Comment


            • #7
              Bruce
              To add a line click the edit button in the Formula Configuration section of the Formula Wizard window


              This will open the following window where you click the add line button.


              Set the properties of the line (Name, Bar Style, Thickness, etc. The Plot Type should already be line by default. Click OK
              Then back in the main Formula Wizard window click the edit button in the Returned Data Points section and select the same CCI study you already have declared (see image below)
              Alex

              Comment


              • #8
                I figured it out and thanks. Bruce

                Comment

                Working...
                X