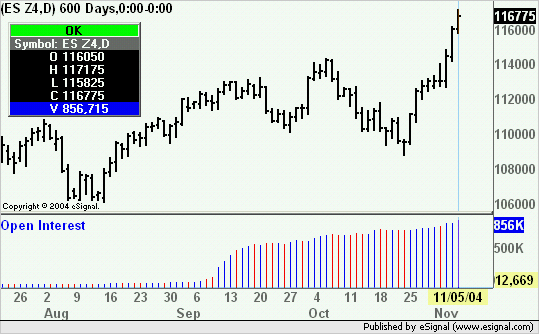
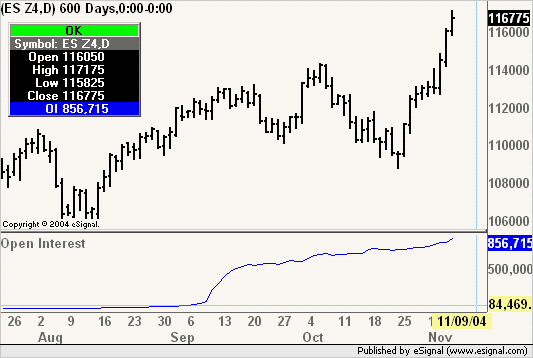
Hi,
I would like to get the Open Interest Data for eg. SP e-Minis into eSignal. Datas are structured in my excel spreadsheet like this:
Date | Volume | Open Interest |Change
11/05/04 838807 888205 9180
My intention is having this datas displayed as a line indikator and as a separate study.
I am looking for a description how to implement excel datas into eSignal and use them as an indicator.
Can anybody help me in finding the right approach how to realize this? Are there any descriptions or developer guides how to realize this?
Or maybe even this indicator exists already and can be used instantly..
Thank you for any help.
Walter


Comment