Announcement

Collapse
No announcement yet.

Import Data from Excel in eSignal

Collapse
X
 
  • Filter
  • Time
  • Show
Clear All
new posts

  • Import Data from Excel in eSignal

    Hi,
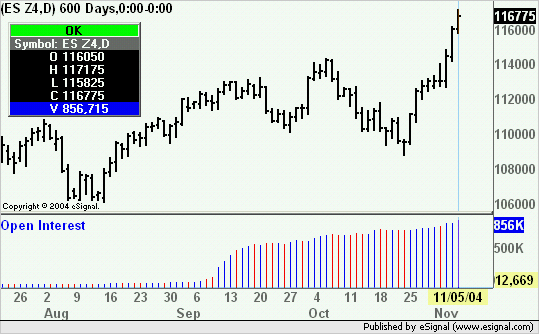
    I would like to get the Open Interest Data for eg. SP e-Minis into eSignal. Datas are structured in my excel spreadsheet like this:

    Date | Volume | Open Interest |Change
    11/05/04 838807 888205 9180


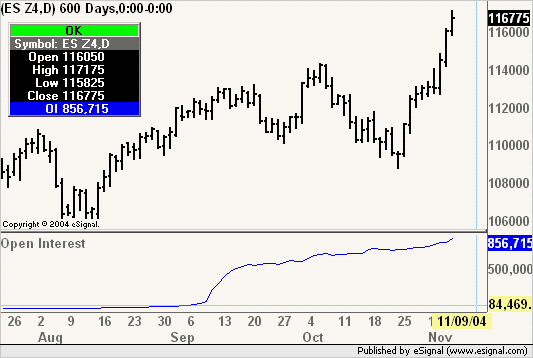
    My intention is having this datas displayed as a line indikator and as a separate study.

    I am looking for a description how to implement excel datas into eSignal and use them as an indicator.

    Can anybody help me in finding the right approach how to realize this? Are there any descriptions or developer guides how to realize this?

    Or maybe even this indicator exists already and can be used instantly..

    Thank you for any help.

    Walter

  • #2
    Walter
    Open Interest is already available as a study in eSignal (right click chart->Basic Studies-Open Interest)
    What other value are you trying to plot on a chart? The net change in Open Interest, Volume, other?
    Alex

    Comment


    • #3
      OI

      Alex, thank you for replying :-)

      I would prefer a line plot rather than a bar plot. And yes, I am interested in a plot of net change in OI and Volume data.

      The point with the eSignal OI basic study is that it can hardly be used as a valueable information because an analyst can't see the trend of OI only from this barchart. Usually OI represents a rising falling or sideway movement over the time. Together with the volume and price of a future market OI can indicate the condition of the future markets - trends, changes.

      And this can be best done with the help of a line chart.

      Because OI is an important indicator for serious future trader. I recommend to the eSignal team to have a look in the "technical analysis..:" written be John J. Murphy who describes very detailed
      this indicator and it's consequences.

      Thanks again
      Walter
      Last edited by watrader; 11-06-2004, 10:12 AM.

      Comment


      • #4
        Demand Index and HPI

        Alex,

        forgot to ask maybe you have an answer:

        I am looking to get following indicators for eSignal:
        Demand Indicator and Herrick Payoff Index (HPI)

        Do you have an idea whether this indicators exists for eSignal and if yes where from they can be downloaded / bought..

        Thanks again
        Walter

        Comment


        • #5
          Walter
          The attached efs will plot Open Interest as either a line or a histogram (selectable through Edit Studies)
          Alex

          Attached Files

          Comment


          • #6
            Walter
            To plot the net change of Open Interest open the efs I attached to the prior message and replace line 36
            return oi(0);
            with
            return (oi(0)-oi(-1));
            Save the efs with a different name.
            To plot the net change of Volume open the efs you just saved, replace all instances of oi with volume and save the efs with a different name.
            Alex

            Comment


            • #7
              OI

              Thank you very much, Alex.

              Comment

              Working...
              X