Announcement

Collapse
No announcement yet.

max2

Collapse
X
 
  • Filter
  • Time
  • Show
Clear All
new posts

  • max2

    Hello Alex,

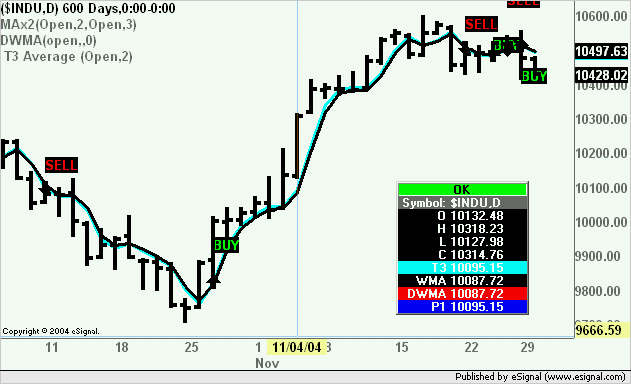
    Need you're assistance, have modified the max2 alert efs to set alert on crossover of T3Ave3 & Dwma. As u can c the in screenshot - the alerts will not display. Also the cyan & black lines are identical with same settings as the lime & red lines thus should overlay one another and clearly they don't. Need you're help to correct this issue.

    Peter
    Attached Files

  • #2
    screenshot
    Attached Files

    Comment


    • #3
      Peter
      The efs you posted calls two other efs(s) ie t3avg3.efs and dwma.efs.
      You will need to either attach them or post a link as to where one can find them
      Alex

      Comment


      • #4
        Ok Alex
        Attached Files

        Comment


        • #5
          T3ave
          Attached Files

          Comment


          • #6
            Peter
            In line 83 of max2crossover.efs replace dwma_1 = dwma_2; with dwma_1 = dwma; and I believe it should work
            Alex

            Comment


            • #7
              Hello Alex,

              that works well but the other issue is that the lime & red lines should be overlayed by the cyan & black when they have the same settings, seems like that the cyan & black lines r shifted 1 interval to the right when they should match up with one another.
              How can this be corrected.

              Peter

              Comment


              • #8
                Peter
                To correct this you need to pass the same parameters the called efs is using. In dwma.efs the parameters for the study are
                function main(sPrice, nLength, nDisplace)
                where nDisplace is set by default at -1.
                In max2crossover.efs you are instead passing these parameters in line 91
                dwma = call("DWMA.efs",Source2,Length2);
                If you change it to
                dwma = call("DWMA.efs",Source2,Length2,-1);
                you should get the plots to overlay.
                If you then want to be able to do this through Edit Studies you will need to add a Function Parameter
                Alex

                Comment


                • #9
                  Alex,

                  that doesn't solve the issue, this lines up the Black line with the Lime which generates buy signals intead of sell signals & sell instead of buy. The Black should match up with the red and Cyan watch up with Lime (screen shot below)

                  Peter

                  Comment


                  • #10
                    Peter
                    There is no screenshot attached. Also I have no idea as to which lime line you are referring as I can see none in either the calling efs or in the called efs(s).
                    As far as I can see if I use the same settings on the called efs(s) that you are using in the calling efs the lines match (see attached image where you can see in the values match in the Cursor Window)
                    Alex

                    Comment


                    • #11
                      Alex,

                      the lime is a t3ave3.efs (length 2) and the red is a Dwma (length 3), same settings for the cyan (2) and black (3) hope this helps.

                      Peter
                      Attached Files

                      Comment


                      • #12
                        Peter
                        As far as I can see the default color is blue and not lime for the t3ave3.efs.
                        Irrespective as you can see in the image I posted in my prior reply if all the parameters used in the max2crossover.efs are applied also to the individual efs(s) then the plots are perfectly overlaid.
                        In the Study Titles you can see the parameters for each of the studies and in the Cursor Window the returns from dwma.efs (labeled DWMA), the t3ave3.efs (labeled P1) and the two from max2crossover.efs (labeled T3 and WMA).
                        At this point I suspect that you are using parameters in the individual efs(s) that are different from those of the calling efs (this is further suggested by the fact that you also have a different color for the plot)
                        Alex

                        Comment


                        • #13
                          Thnx Alex for your time, I will reinstall them and check to see if a have a glitch on my end.

                          Peter

                          Comment

                          Working...
                          X