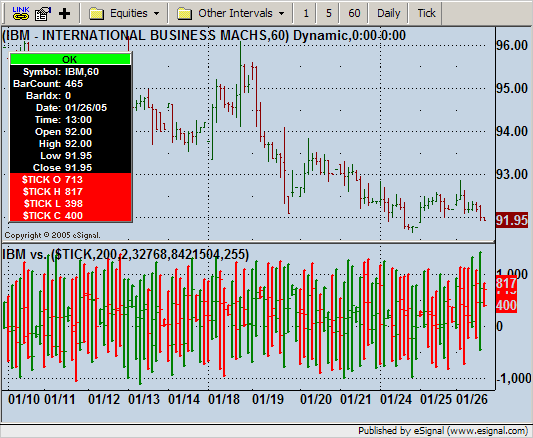
I am wondering if you can help to devise a formula so that I can add $tick to the bottom of a chart as you would add a study for example cci or rsi.
I currently have es #f with vol on a chart, but would like to also add candlesticks of $tick (nyse) below the volume.
I am aware that an efs study is available for tick extremes (in single colour bars) but I actually need the candlesticks to show as they are an integral part of my needs.
Many thanks
Harjap

Comment