Announcement

Collapse
No announcement yet.

Simple Average Range

Collapse
X
 
  • Filter
  • Time
  • Show
Clear All
new posts

  • Simple Average Range

    I was looking for code or the efs for a simple average range. It is different from avg true range in the sense it does not include gaps. It is the high minus the low for the day.

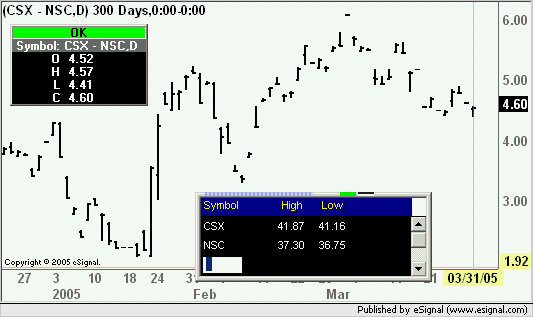
    Found Alexis' maofrange.efs. Thank you Alexis. It seems to work fine with individual stocks but not so well for pairs or spreads. For example on 3/31/05 CSX - NSC had a high of 4.65 and a low of 4.26 thus a simple avg range of .39.

    On it's daily chart the high and low are shown as 4.57 and 4.41. Maofrange efs is calculating ranges and MA's correctly but it is being fed incorrect figures. Am I not filtering prices correctly?

    Two questions: Why are high and lows of day incorrect in daily charts as opposed to other time frames and will there be problems with negative price spreads such as CVX - XOM (-1.29)?

    Any help is greatly appreciated.

  • #2
    WilliamV
    First of all you are most welcome.
    With regards to the CSX - NSC spread I am not clear as to how you are determining the values for High-Low range. As far as I can see CSX High was 41.87 while NSC High was 37.30 which makes for a spread High of 4.57. The Lows were 41.16 for CSX and 36.75 for NSC which makes for a spread Low of 4.41 (see attached chart with inset Quote window). The resulting range of the spread appears to be 0.16
    If you can point me to the Maofrange.efs I may go over it to make sure it is calculating the average correctly.
    Alex

    Comment


    • #3
      I see what is occurring. The daily chart is taking highs and lows as absolutes irrespective of where they were at a particular point in time in relation to one another.

      The low occurred at 9:55 when CSX=41.30 and NSC=37.04.

      Is there a way to use the 5min chart figures in calculating daily simple avg ranges and MA's?

      For your convenience I'm including your maofrange file.

      Thanks for the quick reponse!
      Attached Files
      Last edited by WilliamV; 03-31-2005, 07:58 PM.

      Comment


      • #4
        WilliamV
        That is true for all the intervals ie the spread is calculated based on the High/Low values of that specific interval at that time.
        For that matter even the 5 min intraday high spread of 4.65 would be incorrect then given that on the 1 minute chart the spread went as high as 4.66
        Alex

        Comment


        • #5
          Is there a way to use the high and low of entire day as per 1 min chart in daily calculations of avg ranges and it's ma?

          Comment


          • #6
            WilliamV
            I imagine it is possible but I would suspect that it requires some relatively complex programming
            Alex

            Comment


            • #7
              Alexis,

              Any advice or direction as far as how that can be done.

              Comment

              Working...
              X