I was looking for code or the efs for a simple average range. It is different from avg true range in the sense it does not include gaps. It is the high minus the low for the day.
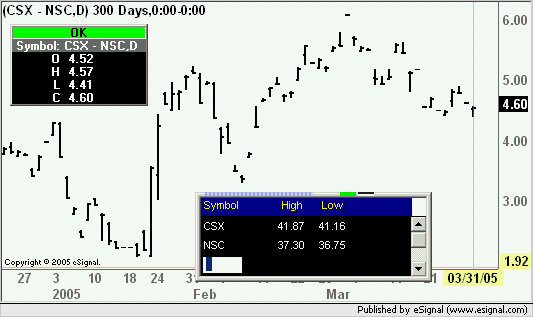
Found Alexis' maofrange.efs. Thank you Alexis. It seems to work fine with individual stocks but not so well for pairs or spreads. For example on 3/31/05 CSX - NSC had a high of 4.65 and a low of 4.26 thus a simple avg range of .39.
On it's daily chart the high and low are shown as 4.57 and 4.41. Maofrange efs is calculating ranges and MA's correctly but it is being fed incorrect figures. Am I not filtering prices correctly?
Two questions: Why are high and lows of day incorrect in daily charts as opposed to other time frames and will there be problems with negative price spreads such as CVX - XOM (-1.29)?
Any help is greatly appreciated.

Comment