Announcement

Collapse
No announcement yet.

Determining Day Session Beginning and End

Collapse
X
 
  • Filter
  • Time
  • Show
Clear All
new posts

  • Determining Day Session Beginning and End

    Looking at an arbitrary symbol (with an arbitrary time template...who knows what users will do!), can anyone suggest a method of determining the opening and closing bar for the day session (including if the open & close bars do not exist in the data defined by the time template)? I realize this is a tall order and that we may have to define a data file that contains the day session time ranges for the various futures and commodities traded on the US exchanges. I have looked into 'getFirstBarIndexOfDay' with an '=2' suffixed to the symbol. It will in fact return the proper index relative to the day session data, but there are three problems with that:

    1. The data our efs study is working with may be defined beyond the day session, so the index of the first bar relative to day session data doesn't really help since that may not be the data that the efs study is working with;

    2. Having the first bar index relative to the day session data doesn't tell me what time the session is to open.

    3. I don't think the '=2' feature is supported for all symbols (or is it?)

    Any ideas would be greatly appreciated.

    Scott
    Scott Masters
    www.tic2tic.com
    [email protected]

  • #2
    Hello Scott,

    Currently, there isn't method that will allow you to identify the start and end times (or bar indexes) for a specific symbol's day-only session without the use of a custom time template. The only thing I can think of that you can do is maintain a data file with start and end times for each symbol, as you mentioned. You'll also need to include instructions for the users to use a 24-hour time template to ensure that all the possible data your EFS needs to reference will exist in the chart data.

    The =2 option does not exist for all symbols, but that could be used for those that do (ie. close(0, "ES #F=2,D")). I'm not sure of the complete list but I now ES, NQ, SP, ND have it. There are only a few others I believe. Note also that in 7.8 or earlier, this will not work by itself on the historical bars. You'll have to add a routine to get the corresponding bar index for the daily interval and then use that index value with getValueAbsolute() while the formula is loading.

    Now in EFS2, due out with 7.9 this month, you won't have to do any synching routines on the historical bars. This is now handled by the new EFS2 engine. All you will need to do is call close(sym("ES #F=2,D")) and you're done. Or you can just reference the current value of that series with close(0, sym("ES #F=2,D")). You will still have the time template problem with the start and end times however.
    Jason K.
    Project Manager
    eSignal - an Interactive Data company

    EFS KnowledgeBase
    JavaScript for EFS Video Series
    EFS Beginner Tutorial Series
    EFS Glossary
    Custom EFS Development Policy

    New User Orientation

    Comment


    • #3
      Jason,

      Thanks for the thoughtful response. A potentially acceptable 'partial' solution would be to compute iIndex = getFirstBarIndexOfDay(getValue("time"), vSym + '=2,D') and then for each bar and check that the value 'iIndex' changed every 'iIndex' bars. This would tell you that the user has the correct number of bars for the day session and that it is a day session chart. If the value 'iIndex' changed less often than every 'iIndex' bars, then the users data contains more than the day session and presumably the additional data would constitute the evening session. The only piece missing is that there is no guarantee that the user has the start and end times correct, but I suppose will have to be left to the user (avoiding the alternative of generating a data file with all of the start and end times).

      Of course, the above solution requires the '=2' feature for day session, which as you mentioned is not available for all symbols. Is there a list of which symbols support this feature? Where can I find documentation on the '=2' feature, or any other such '=x' feature? And finally, if the '=2' feature is just not available on sufficient symbols, is there anyway EFS2 can help me implement the 'partial' solution?

      Thanks for your help!

      Scott
      Last edited by smasters; 04-07-2005, 02:39 PM.
      Scott Masters
      www.tic2tic.com
      [email protected]

      Comment


      • #4
        Hello Scott,

        There's a few more than I previously thought. I believe the list below is a complete list of =2 futures contract symbols. These all have the #F continuous symbol as well.

        AL - Aluminum
        CL - Crude Oil
        EM - Libor
        ES - S&P 500 E-mini
        GC - Gold
        GI - GSCI
        GL - CIG Natural Gas basis swap
        GW - Waha Natura Gas basis swap
        HG - Copper
        HO - Heating Oil
        HU - Gasoline (Unleaded)
        MC - S&P 400 MidCap
        ND - Nasdaq 100
        NG - Natural Gas
        NN - Natural Gas, Euro Style
        NQ - Nasdaq 100 E-mini
        PA - Palladium
        PL - Platinum
        PN - Propane
        RL - Russell 2000
        SC - Brent Crude Oil
        SI - Silver
        SP - S&P 500
        ST - WTI -Brent Calendar Swap
        SW - Brent Calendar Swap


        As for getFirstBarIndexOfDay(), passing in a daily =2 symbol won't work but you gave me an idea. The code below, which should work unless for some reason the first bar of the day in the user's chart happens to be the same bar for the day only session. If that turns out to be a problem then we can modify this routine below to look at the second to last day's data in the chart to detect any data that exists after the close of the day session. The code snippet below is only good for the list of futures contract above of course. Here's the logic. When the chart has completely loaded we'll look at the first bar index of day for the current chart and for the =2 chart of the same interval. If this index value of the current chart is less than (i.e older) than the index value from the =2 chart, then we know the user is not looking at the day only session. Let me know if this works for you.

        PHP Code:

        // make "b" a global var

        if (getCurrentBarIndex() == && == false) {
            var 
        sSymbol getSymbol();
            
        sSymbol sSymbol.replace(/=2/i"");  // strips off the "=2" from sSymbol if present.
            
            
        var iIndexDO getFirstBarIndexOfDay(getValue("time"), sSymbol "=2")
            var 
        iIndex getFirstBarIndexOfDay(getValue("time"));
            
            
        debugPrintln("iIndex:  " iIndex "  iIndexDO: " iIndexDO);
            if (
        iIndex iIndexDO) {
                
        debugPrintln("Evening Session included!!");
            } else {
                
        debugPrintln("Day only.");
            }
            
            
        true

        For any other futures contract, the only way to tell if the chart is including data outside of the day only session is by comparing time stamps from the chart to a hard coded list of start and end times. One other option that would require a little interaction with the user is to add two user-defined parameters where the user would enter the hh:mm start and end time for the symbol they're using. You could force the user to enter this info by checking for null values on these input parameters and immediately calling askForInput([title]), which pops up the Edit Studies dialog for your study. You could use the title parameter to have a message appear in the title of this window to instruct the user to enter the start and end times.
        Jason K.
        Project Manager
        eSignal - an Interactive Data company

        EFS KnowledgeBase
        JavaScript for EFS Video Series
        EFS Beginner Tutorial Series
        EFS Glossary
        Custom EFS Development Policy

        New User Orientation

        Comment


        • #5
          =2 Contracts

          JasonK,

          I'm a little confused by your list of all the symbols supporting the #F and =2 suffix. Isn't the symbol for the Russell 2000 "AB" and not "RL" ? And I get a "no data" response when I try to build a chart from either symbol - "AB M5=2" or "RL M5=2". Am I doing something wrong ?

          A day session only format for the Russell 2000 would be fantastic if it existed - no more problems from that pesky overnight data in tick charts

          Comment


          • #6
            Hello clayb1,

            AB is for the Russell 2000 E-mini. However, we don't have an =2 symbol for that one. Feel free to submit a request to have this added to [email protected].
            Jason K.
            Project Manager
            eSignal - an Interactive Data company

            EFS KnowledgeBase
            JavaScript for EFS Video Series
            EFS Beginner Tutorial Series
            EFS Glossary
            Custom EFS Development Policy

            New User Orientation

            Comment


            • #7
              Thanks for clearing up my confusion Jason - I'll submit a request for that.

              Comment


              • #8
                I have a related problem in my quest to find the day's open and previous day's close for the Russell 2000 e-mini future.

                For today's open, I have a very simple script:

                function main() {

                // We only output on intraday charts
                if (!isIntraday())
                return;

                // Daily chart opens at 15:30 the previous day, which is not what we want
                // So we use a 405 chart (number of trading minutes from 8:30-15:15) as our "daily" chart
                var intOpen = open(sym(getSymbol() + ",405"));

                return intOpen;
                }
                However, this assumes you have a time template in place to hide the overnight session.

                Is there a way to specify a "time template" in the code when fetching the opening price even if there isn't one applied to the chart?

                In other words, I want my intraday 1-min chart to display a 24-hour chart (includes night session data), but when I calculate the day's open, I want to use 8:30 as the opening price (as if a time template was applied). I've found that if I check for the daily open (on a 24 hour chart), I get the opening of the nightly session's open (15:30) and not the 8:30 open.

                Any help is greatly appreciated!
                Daniel
                eSignal File Share: http://share.esignal.com/groupcontents.jsp?groupid=1130

                Comment


                • #9
                  Daniel
                  You can resolve this in the following way.
                  In your Time Template create a Use Defined 405 minute Interval with Start/End Times of 9:30/16:15 ET (or equivalent if in a different time zone).
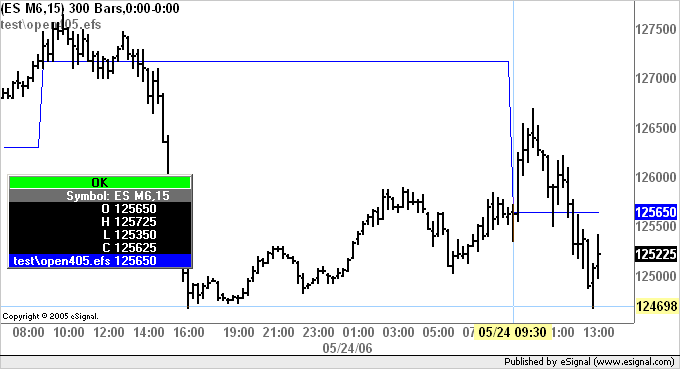
                  Then in your efs you use the inv() function to reference the specific interval eg open(inv(405)). This will give you the value of the Open based on the 405 minute interval.
                  Enclosed below is a sample script and in the image the result showing you that the Open is based on the 405 minute interval even if the chart is set to 24 hours
                  Alex

                  PHP Code:
                  function preMain(){
                      
                  setPriceStudy(true);
                  }

                  function 
                  main(){
                      return 
                  open(inv(405));

                  Comment


                  • #10
                    Daniel
                    See the efs attached to this post for a more complete example
                    Alex

                    Comment


                    • #11
                      Thanks! I managed to get my script to work very well. However, if I leave eSignal on overnight, and the new day's open occurs, the lines continue drawing at their previous locations and not the new day's locations. Even if I reload the script (or remove and re-add) it won't properly draw the day's open or previous day's close. To solve the problem, I just close and reopen eSignal.

                      Is there a way to make it automatically draw at the correct location without having to restart eSignal?

                      Thanks!
                      Daniel
                      Last edited by neoikon; 05-30-2006, 08:35 AM.
                      eSignal File Share: http://share.esignal.com/groupcontents.jsp?groupid=1130

                      Comment


                      • #12
                        Hello neoikon,

                        Please post the formula you are working with so we can see the code you are having trouble with.
                        Jason K.
                        Project Manager
                        eSignal - an Interactive Data company

                        EFS KnowledgeBase
                        JavaScript for EFS Video Series
                        EFS Beginner Tutorial Series
                        EFS Glossary
                        Custom EFS Development Policy

                        New User Orientation

                        Comment


                        • #13
                          Here is the code below. Its pretty simple and straight forward. I created a custom time template with interval 419, beginning at 8:30 and ending at 15:29.


                          PHP Code:
                          function preMain() {
                              
                          debugClear();
                              
                              
                          setPriceStudy(true);

                              
                          setStudyTitle("Today's Open and Previous Close");

                              
                          setShowTitleParameters(false);
                              
                          setShowCursorLabel(false);

                              
                          setCursorLabelName("TodayOpen"0);
                              
                          setDefaultBarFgColor(Color.lime,0);
                              
                          setPlotType(PLOTTYPE_FLATLINES,0);
                              
                          setDefaultBarThickness(4,0);
                              
                              
                          setCursorLabelName("PrevClose");
                              
                          setDefaultBarFgColor(Color.red,1);
                              
                          setPlotType(PLOTTYPE_FLATLINES,1);
                              
                          setDefaultBarThickness(4,1);
                              
                              var 
                          fp1 = new FunctionParameter("MAX_TIMEFRAME"FunctionParameter.NUMBER);
                              
                          fp1.setName("Max Time Frame:")
                              
                          fp1.addOption(1);
                              
                          fp1.addOption(3);
                              
                          fp1.addOption(9);
                              
                          fp1.addOption(15);
                              
                          fp1.addOption(45);
                              
                          fp1.addOption(81);
                              
                          fp1.setDefault(9);
                          }

                          function 
                          main(MAX_TIMEFRAME) {

                              
                          // We only output on intraday charts less than given max
                              
                          if (!isIntraday() || getInterval() == 419 || getInterval() > MAX_TIMEFRAME)
                                  return;

                              
                          // Daily chart opens at 15:30 the previous day, which is not what we want
                              // So we use a 419 chart (number of trading minutes from 8:30-15:29) as our "daily" chart
                              
                          var intOpen open(inv(419));
                              var 
                          intPrevClose close(-1inv(419));    
                              
                              return new Array(
                          intOpenintPrevClose);

                          eSignal File Share: http://share.esignal.com/groupcontents.jsp?groupid=1130

                          Comment

                          Working...
                          X