Announcement

Collapse
No announcement yet.

Multiple time Frames

Collapse
This topic is closed.
X
X
 
  • Filter
  • Time
  • Show
Clear All
new posts

  • #16
    Time Frames

    Good Morning,

    Thank you for explaining the operation of the time interval moving averages.

    Based on the custom moving average in the custom EFS2 folder, I have tested several options using the "menu" features for conveniently changing variables. I would now like to convert this code to the lease amount of lines of coding to stream line a custom EFS which has many moving averages. The following is an attempt to do so, however the interval does not respond when changed in the EFS indicating the structure of the formula is incorrect. I would like to define all variables in the
    xMA EFS formula and not go through the edit studies or menues. Could someone please suggest the corrections to the following EFS coding to allow for proper operation?

    Best Regards,

    Alan


    /************************************************** *******
    By Alexis C. Montenegro for eSignal © December 2004
    Use and/or modify this code freely. If you redistribute it
    please include this and/or any other comment blocks and a
    description of any changes you make.
    The following has been streamlined.
    ************************************************** ********/

    function preMain() {

    setPriceStudy(true);
    setStudyTitle("MAmod");
    setCursorLabelName("MAmod",0);
    setDefaultBarFgColor(Color.blue,0);
    setPlotType(PLOTTYPE_LINE,0);
    setDefaultBarThickness(1,0);

    }


    var xMA = null;

    function main(Type,Length,Source,Symbol,Interval,Offset,Par ams) {


    xMA = offsetSeries(eval(sma)(3,eval(close)(sym("YM M5","17t"))),-3);


    return getSeries(xMA);
    }
    Comment


    • #17
      Alan
      Just use the desired average function (sma(), ema(), etc) and fill in the parameters you want to assign. For the complete syntax see either the Help file (accessible directly from the Formula Editor) or at this link
      Your example would be written as follows
      offsetSeries(sma(3,sym("ym m5,17t")),-3)
      Alex

      Comment


      • #18
        Time Frame

        Good Morning,

        The attached EFS contains 3 moving averages with different intervals in 7.9. The symbol in each MA is the same (YM M5). All terms in the MA remain constant and only the symbol changes when the contract expires. How would I define the symbol without the interval outside of the MA formula so that when the contract expires I only change the contract name in one location rather than going into each line of code?

        Is it possible to specify the symbol in a separate file ( like a global variable ) so that it would update numerous EFS files when the contract changes?

        Best Regards,

        Alan
        Attached Files

        Comment


        • #19
          Alan
          Make the symbol a user defined variable after which you concatenate a comma (as a string) and the preset interval. This will convert the symbol and interval to a single string. If you open any one of the studies in the EFS2 Custom folder you can see how it is done
          Alex

          Comment


          • #20
            time frames

            Thank you.

            Can this be done out side of a single EFS so a symbol change can drive the concatenation in numerous EFS files?

            Best regards,

            Alan

            Comment


            • #21
              Intervals

              Thank you. The concatenation works great.

              The attached chart shows a 20T and 1M moving average on a 20T chart. Previously I used global variables for the longer time periods and these updated and plotted a new value on each bar of the 20T chart. Is it possible to get the interval function to update the 1 minute value on every 20T bar instead of what looks like once per minute?

              Best Regards,

              Alan
              Attached Files

              Comment


              • #22
                Alan
                See this reply to a similar question in this same thread
                Alex

                Comment


                • #23
                  time Frame

                  Thank you for the reminder. I am sorry I missed that prior pont.

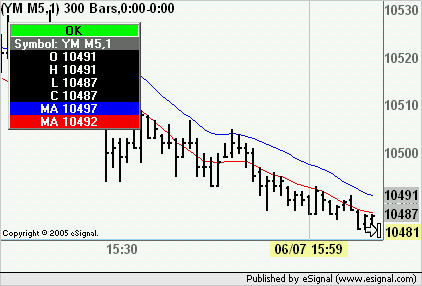
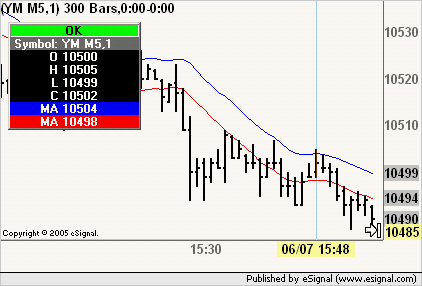
                  The attached right chart shows a 1 minute time period with a 15 period moving average. (using 15ema) The left chart is a 20T basis with the interval logic. (using customMA79). Note the 1 minute chart passes a global variable to the 20T chart and they match at 10504. (top jagged line) The bottom jagged line is the interval logic which has the correct registration but a lower value of 10498. Why are the values so different?

                  Best Regards,

                  Alan
                  Attached Files

                  Comment


                  • #24
                    interval

                    The chart did not attach due to size. The following chart shows 10497 which matches the 1 minute chart but the nearly constant offset with the interval chart of 7 points continues.

                    Best Regards,

                    Alan
                    Attached Files

                    Comment


                    • #25
                      Interval

                      Attached is the 1 minute ema efs.

                      Alan
                      Attached Files

                      Comment


                      • #26
                        Alan

                        Note the 1 minute chart passes a global variable to the 20T chart and they match at 10504. (top jagged line) The bottom jagged line is the interval logic which has the correct registration but a lower value of 10498. Why are the values so different?

                        I suspect that is because you are comparing averages computed on different data series ie one based on the High and the other on the Low. Notice in the next two images how the values of the two averages I am plotting match those mentioned by you (or shown in the image you posted)
                        Alex


                        Comment


                        • #27
                          Time Frames

                          Alex,

                          Last night I started receiving error messages for syntax errors relative to "Apache Tomcat" what ever that is and eSignal crashed several times. I spoke with eSignal tech suport this morning and they suggested uninstalling eSignal and searching for and deleteing all files including ( winros.*, winsig.* and reader.ini ) These were not the instructions I was given by Liverep when I recently converted to 7.9. Tech service stated they will review the above steps with Liverep to insure others do not have these problems.

                          After reloading eSignal and getting back to normal this morning, the following script properly handles importing 60T global variables into a 20T chart, 60T intervals on a 20T chart, getseries and getvaules, concatination and also works properly in backtesting which was reported in a separate thread.

                          Thank you for your patience and support.

                          Best Regards,

                          Alan

                          /************************************************** *******
                          CodeA test of interval concatination and global variable
                          ************************************************** ********/

                          function preMain() {

                          setPriceStudy(true);
                          setStudyTitle("CodeA");
                          setCursorLabelName("CodeA",0);
                          setDefaultBarStyle(PS_SOLID, 0);
                          setDefaultBarFgColor(Color.blue, 0);
                          setDefaultBarThickness(2, 0);
                          setPlotType(PLOTTYPE_LINE, 0);


                          Symbol1 = "YM M5";
                          Interval1 = "60T";
                          Interval2 = "60T";

                          }


                          function main() {

                          var vSymbol = Symbol1+","+Interval1;
                          xMA1 = offsetSeries(eval(sma)(15,eval(high)(sym(vSymbol)) ),0);
                          var vSymbol = Symbol1+","+Interval2;
                          xMA2 = offsetSeries(eval(sma)(15,eval(high)(sym(vSymbol)) ),0);

                          var x1 = getGlobalValue("MMA2");

                          return new Array(getSeries(xMA1), (xMA2.getValue(0)-1), (x1+1));
                          }

                          Comment


                          • #28
                            Alan
                            Glad to hear you resolved your issues. Also replacing low() with high() in the second moving average definitely helped as that was one of the problems that I could see
                            Alex

                            Comment

                            Working...
                            X