Announcement

Collapse
No announcement yet.

RSI Study

Collapse
X
 
  • Filter
  • Time
  • Show
Clear All
new posts

  • RSI Study

    I'm looking for help with a custom RSI if anyone is in the position to do so...?

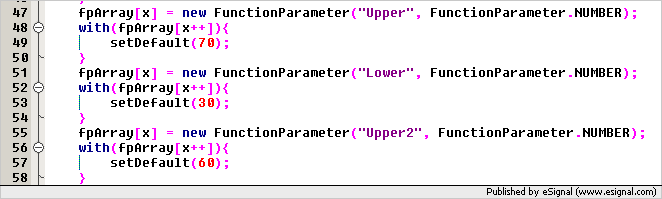
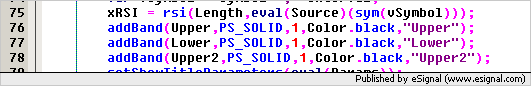
    What I need is a bog-standard RSI with 4 customizable horizontal lines. So, instead of the usual 2 lines at 30% and 70%, I would like to be able to input 4 lines and then also edit their positions in terms of percentage. That means I might want to place lines at 80%, 60%, 40% and 20% on one chart, and then at 90%, 80%, 20% and 10% on another chart.

    Being able to edit the line colors would be a bonus too...

    Anyone? Please...?

  • #2
    DEFX
    The customRSI.efs in the EFS2 Custom folder already includes 2 user definable bands which can be easily used as examples to add more.
    The first step is to define the parameter itself. To do this you can copy lines 47-50 and paste them in line 55 Then rename "Upper" in line 55 to "Upper2" and set the desired default value (see following image)


    Then you need to add the name of that parameter to the main definition. This must be inserted in the same order in which you have defined the parameters (see following image)


    Lastly in the main function you add the command to draw another band just after the existing commands. In that command you now use the new parameter you have just defined (see following image)


    Repeat the whole process to add a second "Lower" line.
    Also see this post which illustrates how to add user defined parameters in an efs.
    Alex

    Comment


    • #3
      Hey Alexis, Thanks a ton!!! That truly did the trick.

      If I might impose on your kindness and ask one more favour?

      I now wish to add two moving averages to that new RSI2. That is; I wish for the moving average lines to appear in the RSI pane rather than the price window. Could you perhaps provide similar guidance in accomplishing that task? I'd be most obliged.

      Regards.

      Comment


      • #4
        DEFX
        If you click here you can find a pre-programmed efs that computes the RSI and its moving average.
        All parameters for both the RSI and the MA are user definable and the efs is preset for use with multiple intervals and/or symbols
        Alex

        Comment


        • #5
          Thanks again Alexis. I'm most grateful.

          I managed to include the extra lines into this one as well. I did also try editing the efs to include a second MA, but alas, my efs and programming knowledge are non-existant.

          I'm studying Technical Analysis with Constance Brown and she makes use of an RSI with 2 MA's as well as a Stochastic with 2 MA's. Although the study material does provide all of the formulae for the indicators, it is all for TradeStation and not for eSignal; hence my dillema.

          In any event; a HUGE thanks!!!
          Last edited by DEFX; 10-19-2005, 08:20 AM.

          Comment


          • #6
            DEFX
            If you are unfamiliar with programming in general or with EFS then the better solution at this time may be for you to use the Formula Wizard which makes it relatively easy to write studies such as the one you want.
            For information and examples on how to use the Formula Wizard see the Formula Wizard Guide in the EFS KnowledgeBase. At the bottom of that guide you will find a link to a complete example on how to create a study on study which as it happens is an MA of RSI.
            Then as you get acquainted with EFS you may want to go through the other guides that are provided in the EFS KnowledgeBase.
            Alex

            Comment


            • #7
              Hey thanks. I'll give that a go and let you know how I get along.
              ---

              Edited to add:

              Well, that was easy enough. I managed to create the RSI with 2 MA's, but of course, now I have no horizontal lines on the indicator...? Guess I'll have to start working on EFS....
              Last edited by DEFX; 10-19-2005, 02:41 PM.

              Comment


              • #8
                DEFX
                You will need to use the Editor to add the bands as that cannot be done with the Formula Wizard.
                The simplest solution is to use the builtinRSI.efs (which is in the Builtin folder) as an example to add the bands to your script. If you find yourself in need post your efs and someone may be available to help.
                Alex

                Comment


                • #9
                  Would it not somehow be simpler to add a second MA to the following script (of yours) rather than using the BuiltIn RSI? This one already has the horizontal channels included at 80%, 65%, 40% and 30%...?
                  ---
                  /************************************************** *******
                  Alexis C. Montenegro © December 2004
                  Use and/or modify this code freely. If you redistribute it
                  please include this and/or any other comment blocks and a
                  description of any changes you make.
                  ************************************************** ********/

                  var fpArray = new Array();

                  function preMain() {

                  setStudyTitle("MAofRSI");
                  setCursorLabelName("RSI", 0);
                  setCursorLabelName("MAofRSI", 1);
                  setDefaultBarFgColor(Color.blue, 0);
                  setDefaultBarFgColor(Color.red, 1);
                  setDefaultBarThickness(1,0);
                  setDefaultBarThickness(1,1);
                  setStudyMin(0);
                  setStudyMax(100);
                  askForInput();

                  var x=0;
                  fpArray[x] = new FunctionParameter("Length", FunctionParameter.NUMBER);
                  with(fpArray[x++]){
                  setLowerLimit(1);
                  setDefault(14);
                  }
                  fpArray[x] = new FunctionParameter("Source", FunctionParameter.STRING);
                  with(fpArray[x++]){
                  addOption("open");
                  addOption("high");
                  addOption("low");
                  addOption("close");
                  addOption("hl2");
                  addOption("hlc3");
                  addOption("ohlc4");
                  setDefault("close");
                  }
                  fpArray[x] = new FunctionParameter("Symbol", FunctionParameter.STRING);
                  with(fpArray[x++]){
                  setDefault();
                  }
                  fpArray[x] = new FunctionParameter("Interval", FunctionParameter.STRING);
                  with(fpArray[x++]){
                  setDefault();
                  }
                  fpArray[x] = new FunctionParameter("MAType", FunctionParameter.STRING);
                  with(fpArray[x++]){
                  addOption("sma");
                  addOption("ema");
                  addOption("wma");
                  setDefault("sma");
                  }
                  fpArray[x] = new FunctionParameter("MALength", FunctionParameter.NUMBER);
                  with(fpArray[x++]){
                  setLowerLimit(1);
                  setDefault(14);
                  }
                  fpArray[x] = new FunctionParameter("LineColor1", FunctionParameter.COLOR);
                  with(fpArray[x++]){
                  setName("Color1");
                  setDefault(Color.blue);
                  }
                  fpArray[x] = new FunctionParameter("LineColor2", FunctionParameter.COLOR);
                  with(fpArray[x++]){
                  setName("Color2");
                  setDefault(Color.red);
                  }
                  fpArray[x] = new FunctionParameter("Upper1", FunctionParameter.NUMBER);
                  with(fpArray[x++]){
                  setDefault(80);
                  }
                  fpArray[x] = new FunctionParameter("Lower1", FunctionParameter.NUMBER);
                  with(fpArray[x++]){
                  setDefault(40);
                  }
                  fpArray[x] = new FunctionParameter("Upper2", FunctionParameter.NUMBER);
                  with(fpArray[x++]){
                  setDefault(65);
                  }
                  fpArray[x] = new FunctionParameter("Lower2", FunctionParameter.NUMBER);
                  with(fpArray[x++]){
                  setDefault(30);
                  }
                  fpArray[x] = new FunctionParameter("Params", FunctionParameter.BOOLEAN);
                  with(fpArray[x++]){
                  setName("Show Parameters");
                  setDefault(false);
                  }
                  }

                  var bInit = false;
                  var xRSI = null;
                  var xMAofRSI = null;

                  function main(Length,Source,Symbol,Interval,MAType,MALength ,LineColor1,LineColor2,Upper1,Lower1,Upper2,Lower2 ,Params) {

                  if(bInit == false){
                  if(Symbol == null) Symbol = getSymbol();
                  if(Interval == null) Interval = getInterval();
                  var vSymbol = Symbol+","+Interval;
                  xRSI = rsi(Length,eval(Source)(sym(vSymbol)));
                  xMAofRSI = eval(MAType)(MALength,rsi(Length,eval(Source)(sym( vSymbol))));
                  setDefaultBarFgColor(LineColor1,0);
                  setDefaultBarFgColor(LineColor2,1);
                  addBand(Upper1,PS_SOLID,1,Color.green,"Upper1");
                  addBand(Lower1,PS_SOLID,1,Color.green,"Lower1");
                  addBand(Upper2,PS_SOLID,1,Color.red,"Upper2");
                  addBand(Lower2,PS_SOLID,1,Color.red,"Lower2");
                  setShowTitleParameters(eval(Params));
                  bInit = true;
                  }

                  return new Array (getSeries(xRSI),getSeries(xMAofRSI));
                  }

                  Comment


                  • #10
                    DEFX
                    The solution I suggested is far simpler because all you need to do is copy the addBand() commands from the builtinRSI.efs and paste them into your script replacing the Upper/Lower parameter with the value at which you want to draw the band.
                    Alex

                    Comment


                    • #11
                      Okay gotcha. I'll do my best...

                      Comment


                      • #12
                        Thank you. Most grateful. It works just nicely.

                        Comment

                        Working...
                        X