Announcement

Collapse
No announcement yet.

MACD of RelativeStrengthRatio

Collapse
X
 
  • Filter
  • Time
  • Show
Clear All
new posts

  • MACD of RelativeStrengthRatio

    Hi,

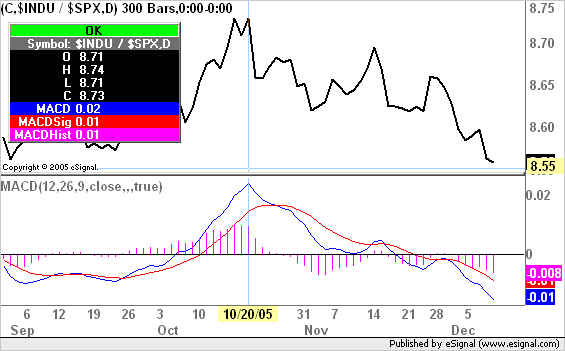
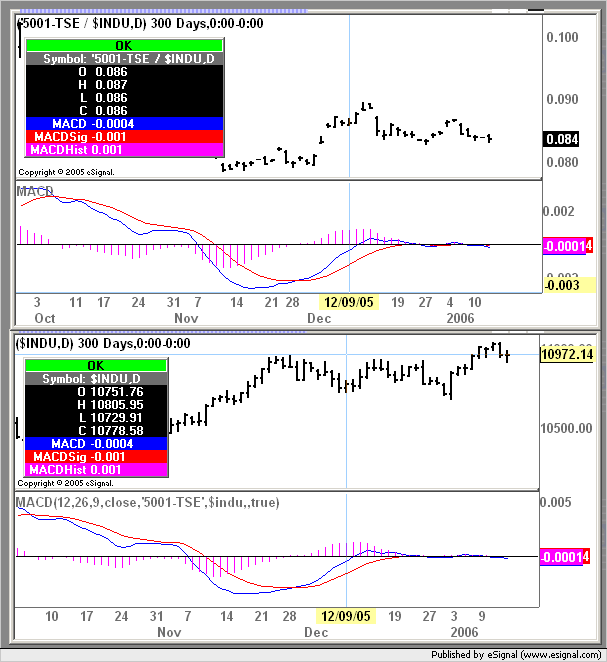
    I'm looking for an efs that will give the MACD Histogram of a Relative Strength Ratio. The MACD Histogram should have different colors for up and down movements.

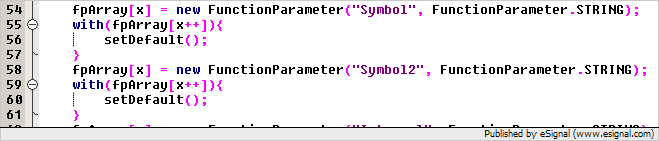
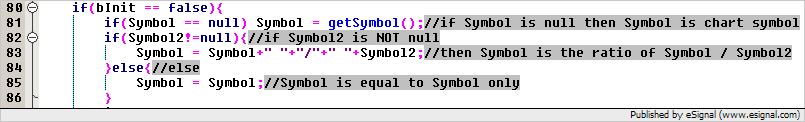
    In fact, what I mean is an integration of efs's that already exist: MACDColorHist.efs and RelativeStrengthRatio.efs, also with the same variables.

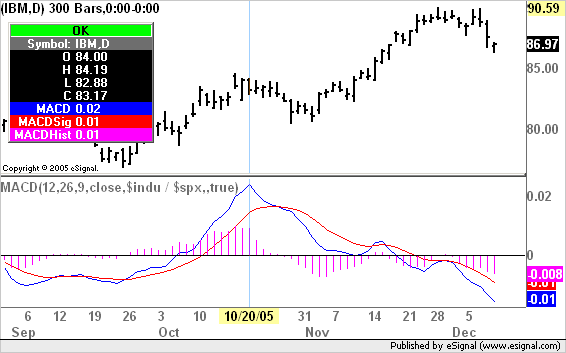
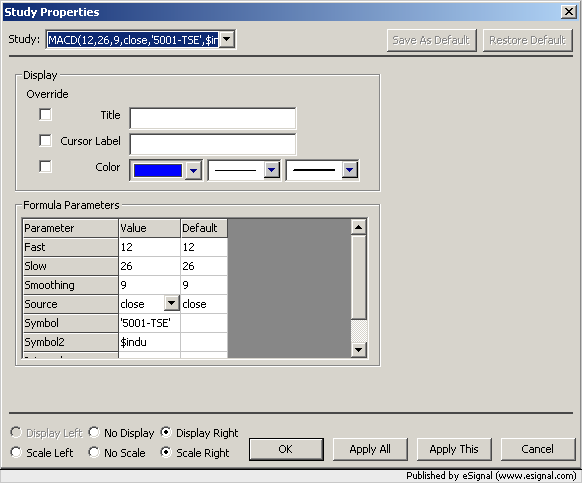
    Earlier, I created r.s. ratios as new symbols and then used standard indicators, such as macd. However, it would be a lot easier to have the macd of the rsr in a direct combination with the price chart.

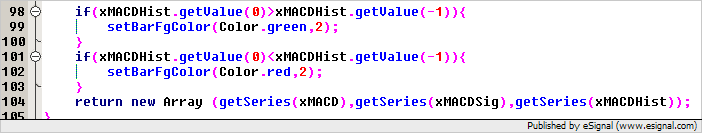
    I tried to program something myself, but it only resulted into So, I'd really appreciate it if anyone can help me.

    Thanks,

    Cor de Vrieze

  • #2
    cordevrieze
    The customMACD.efs which is in the EFS2 Custom folder is already enabled to use external symbols and/or intervals.
    What this means is that while you are plotting a symbol in the price window you can compute the MACD based on another symbol or in your case a spread/ratio.
    In the first image shown below you can see the MACD based on the chart symbol which is the ratio of $INDU / $SPX. In the second chart you can see that although the main symbol is IBM the MACD is computed on the symbol $INDU / $SPX and returns the same results
    Alex


    Comment


    • #3
      Alex,

      Thanks for your reply. I was not aware of this possibility in customMACD. However, I am not sure that this is what I'm looking for.

      In your second chart you gave the example of IBM with the MACD of $INDU / $SPX. What I'd like there is IBM with the MACD of IBM / $SPX. And with XYZ as the next in the list to click trough, XYZ with the MACD of XYZ / $SPX, and so on.

      To try a solution, in custumMACD I filled in "close / $SPX" as symbol, but it did not work. The indicator part of the chart kept loading, with no result, so probably something is wrong with that.

      In addition, instead of the MACD as in customMACD, I prefer the MACD Histogram with different colors for up and down movements, as in MACDColorHist.efs. Is there a possibility to have the up-and-down-colors in customMACD, or otherwise to have MACDColorHist customised?

      Thanks again,
      Cor

      Comment


      • #4
        Cor
        In the example I posted I was just showing you that you can compute the MACD on any symbol (including spreads, ratios, etc) even if it is not the one being plotted in the price window.
        In your example all you needed to do was type IBM / $SPX in the Symbol box in Edit Studies and the MACD would have been computed on that ratio.
        Anyhow it is possible to modify the customMACD efs to include a second user defined symbol which would then automatically generate the spread symbol used by the MACD.
        If you are interested in doing it yourself here are the illustrated instructions on how to modify the MACD for that purpose
        In preMain add a second FunctionParameter for "Symbol2" just below the FunctionParameter for "Symbol". In the following image I am showing both the already existing FunctionParameter (for reference) and the one you need to add


        The in the main() definition add Symbol2 to the list contained in the parenthesis as shown in the following image


        At this point in main inside the bInit statement insert the additional code shown in the following image right after the line if(symbol==null) Symbol = getInterval();. As In previous examples some of the existing code is shown to provide a reference.


        As to painting the histogram again that is only a question of adding the required conditions in the efs. Insert the following section of code just above the return statement


        Once you implement these changes the MACD can be used as a normal MACD of the symbol being plotted on the chart or if a symbol is inserted in the Symbol2 box in Edit Studies then it will automatically create a ratio between the chart symbol (or the symbol in the Symbol box) and Symbol2. This allows for maximum flexibility
        Alex

        Comment


        • #5
          I can't find the Custom ES2 folder anywhere in my system or online. I'm running eSignal 7.8. Is that part of the 7.9.1 version?

          Comment


          • #6
            probtrader
            That folder is installed with version 7.9.1
            Alex

            Comment


            • #7
              Alex,

              The indicator works very well and is exactly what I was looking for! Thanks for your help.

              Is it possible to add a few extra options?
              - type of MA: SMA or EMA
              - only display the histogram, not the macd
              - macd or macd%

              Cor

              Comment


              • #8
                Cor
                1) The EFS2 MACD function only uses exponential moving averages for both the MACD and Signal lines. If you want the option to use a simple moving average you will need to create your own MACD study. For an example on how to do this see the Chaikin Oscillator in this thread.
                2) To do that you just need to modify the return statement and return only the MACD Histogram. You will need to adjust some statements in preMain() to assign the appropriate plot type, color, etc.
                3) The oscillator in the MACD is expressed as a price value only. If you need to express it as a percentage (as in the Price Oscillator for example) you will need to create your own MACD study (see point 1)
                Alex

                Comment


                • #9
                  Alex,

                  Thanks for your reply.

                  I saw the thread you referred to. Although my first experience in programming in EFS didn't give me a very good feeling, to make ajustments in the custom efs's, as in the examples in the tread, may not be that difficult after all. I'll give it a try.

                  Cor

                  Comment


                  • #10
                    Alex,

                    I followed your suggestions and the indicator works terrific. Thanks.

                    There is one exception. The macd-of-rs is not computed in the case of Japanese or HongKong stocks relative to some benchmark.
                    I think the reason is that the symbols are numeric, e.g. 5001-TSE and 0001-HKG. I used $aw01-ftse as a benchmark in symbol2 (for efs-code see your reply of dec 13).
                    Somehow the new symbols of which the macd-of-rs had to be computed (so 5001-TSE/$aw01-ftse and 0001-HKG/$aw01-ftse) are not recognised. In case of a non-numerical symbol, as in DELL/$aw01-ftse or IBM/$indu this problem does not occur.

                    Is there a way to solve this problem?

                    Cor

                    Comment


                    • #11
                      Cor
                      In a spread the symbols that begin with a number need to be enclosed with an apostrophe ie '6A H6'.
                      For more information on spreads see this article in the eSignal KnowledgeBase
                      Alex

                      Comment


                      • #12
                        Alex,

                        I understand that numeric symbols must be written between apostrophes when they are used to define spreads.
                        However, what I meant is another situation. I changed the customMACD in such a way that a Symbol2 can be defined as a benchmark, so that the customMACD will represent the MACD of the relative strength. I did this by modifying the efs code as you suggested in this thread.
                        So, when I define the benchmark Symbol2 as $indu, and I click on DELL in the quote window, then I get the MACD of DELL/$indu; however, when I click on 5001-TSE, I should get the MACD of 5001-TSE/$indu, but that doesn't work.
                        I suppose the solution must be found in the efs code. Must the apostrophes be included there? And, if so, how should that be done?

                        Cor

                        Comment


                        • #13
                          Cor
                          As far as I can see the solution I suggested is working fine even using 5001-TSE as Symbol.
                          You need to add the apostrophes in Edit Studies in the Symbol box as shown in the following image


                          The result is shown in the next image where I compare a MACD of the spread as the chart symbol and the MACD of the spread as an external symbol. Note that in the latter the parameters in the Study Title show the symbol 5001-TSE enclosed by apostrophes
                          Alex

                          Comment


                          • #14
                            Cor
                            In reading your message again I see what you are doing ie you are not entering the first symbol of the spread in the Edit Studies box but getting it from the chart. In that case replace
                            Symbol = Symbol+" "+"/"+" "+Symbol2;
                            with
                            Symbol = "'"+Symbol+"'"+" "+"/"+" "+Symbol2;
                            This will add the required apostrophes to the symbol
                            Alex

                            Comment


                            • #15
                              Alex,

                              That's what I was looking for.
                              I modified customStochastics in the same way as customMACD. Both work very well.

                              Thanks for your help.

                              Cor

                              Comment

                              Working...
                              X