Announcement

Collapse
No announcement yet.

ADX with level?

Collapse
X
 
  • Filter
  • Time
  • Show
Clear All
new posts

  • ADX with level?

    Hello. I can't find an ADX study with the level of the directional movement.

    The indicator says that when the directional movement is below a certain level, (I use 20), this means the market is not trending.

    But I can't find an EFS study of ADX wich displays on the chart an horizontal line, a level that makes easy and immediate to see when the market is trending or not.
    I think this would be a really useful feature.

    I hope somebody can help me, giving me this efs study.
    I'm not able to do it on my own.

    Thank you very much.
    And happy new year!

    (I prefer to use esignal 7.6, I don't know if in the new version of esignal the Adx has this feature).

  • #2
    I just use the Directional Movement indicator found in Basic Studies. Then uncheck the +/-DMI boxes. Then draw a horizontal line where you want it.

    Hope this helps.

    Russ

    Comment


    • #3
      Originally posted by trader123
      I just use the Directional Movement indicator found in Basic Studies. Then uncheck the +/-DMI boxes. Then draw a horizontal line where you want it.

      Hope this helps.

      Russ
      Yes, that's what I do.
      I use the histogram, I uncheck the +/i dmi boxes, and than I draw a line and it becomes a great indicator in my opinion.

      The problem is that trading stocks, I have every day new stocks to analyze, and it's impossible to draw every single time that line...

      Thanks for your answer

      Comment


      • #4
        Hi oceantrader,

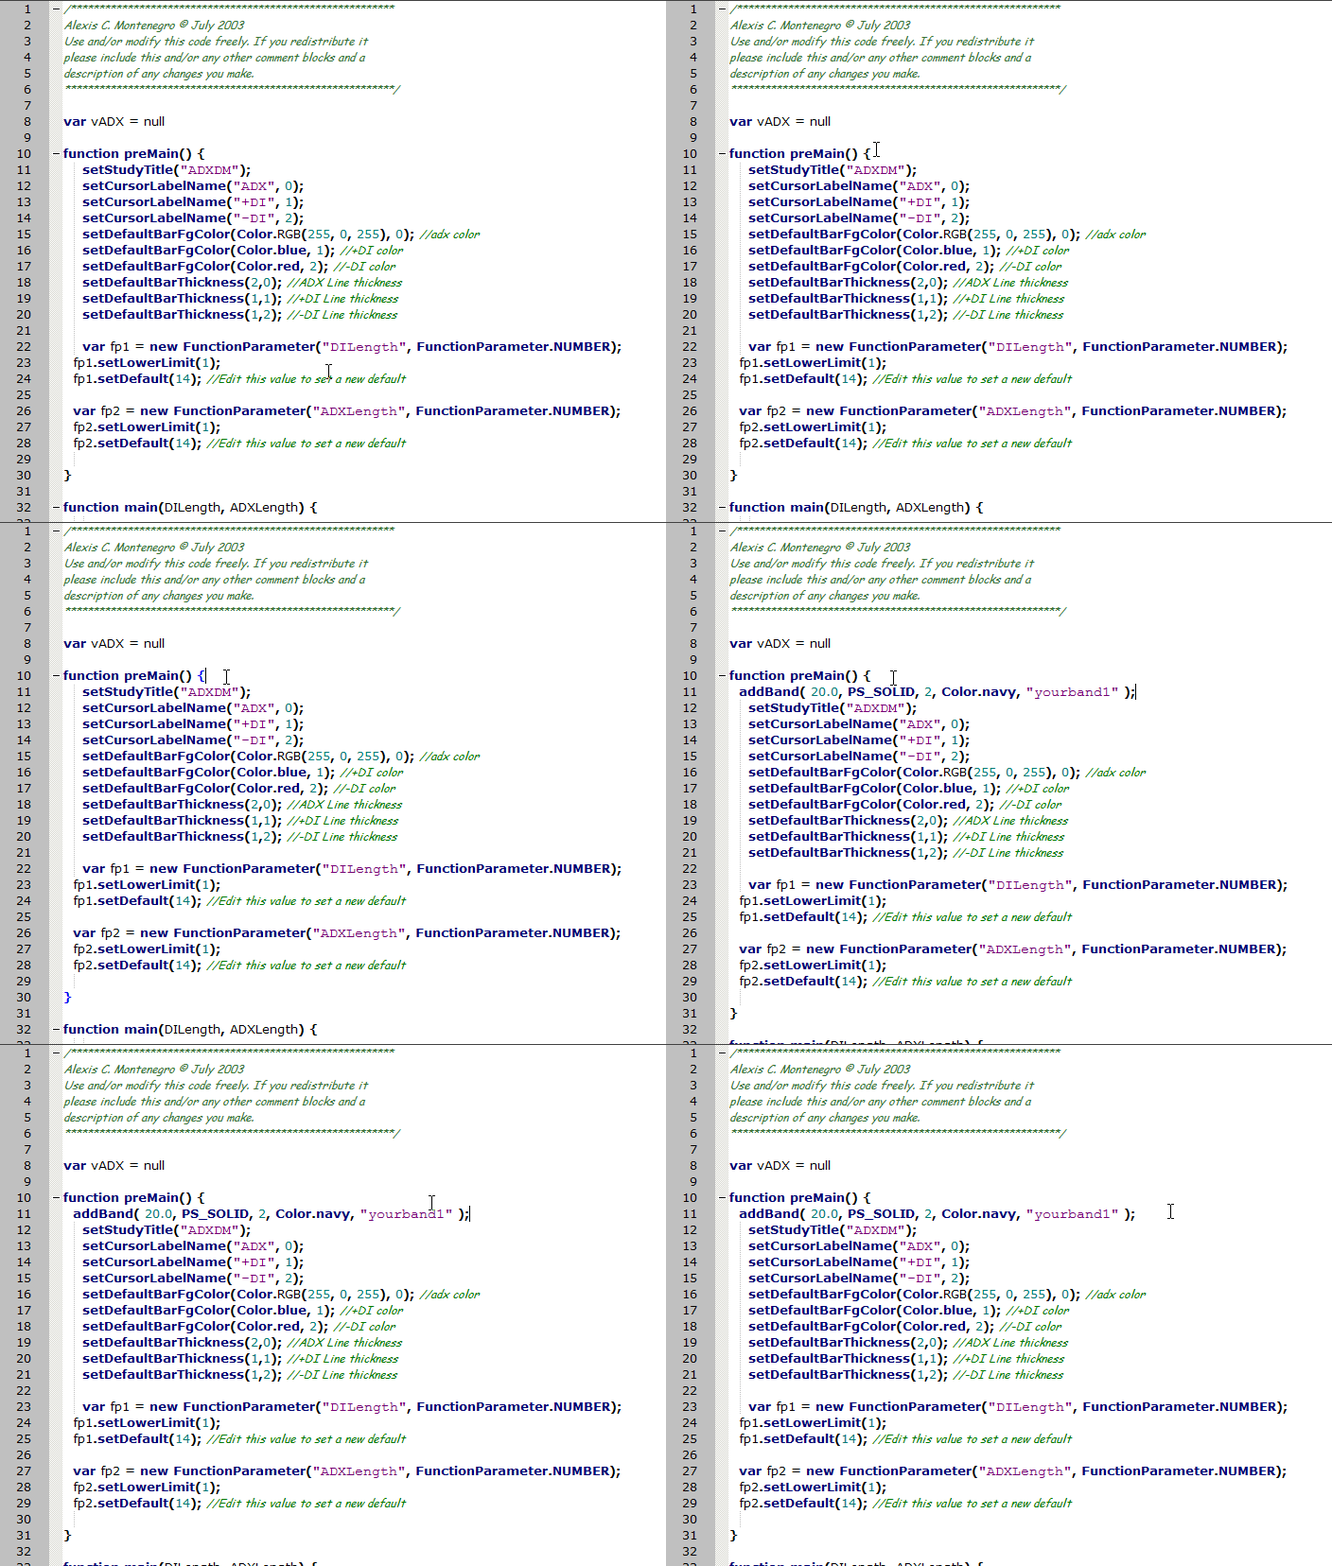
        I put together a little animation showing you what to do with your efs to add a band. It is straightforward. You can use the efs editor to open and edit the formula. I would save it under a different name when you are done.

        Here is the line of code I pasted into the efs addBand( 20.0, PS_SOLID, 2, Color.navy, "yourband1" );

        I did not add any comment to the line due to the extra time it would take to record, and the resultant file time. However, it is a good practice and usually requested by the author of the efs for several reasons. The first is so that it has been modified so that any user can tell where the efs was modified, and secondly to aid in later troubleshooting if required.

        Here is a link to the efs command.

        I hope this is of some help...

        Comment


        • #5
          I did it and it works.
          I used the Builtin ADXDM.efs, but now I can't hide the +DI and -DI lines form the indicator, as I do with the Basic Studies when I uncheck the display boxes of +DI and -DI.
          The only thing I was able to do was to change the color of these lines to white (my background color), but the result is not very good because of the many crossovers.

          I need to know how to hide those 2 lines...
          Or to find and ADX.efs with all the function the are in the ADX found in Basic Studies.

          I tried to use the customADXDM.efs, wich is the other ADX efs I found, but it doesn't work, it gives me syntax error.

          Thanks

          Comment


          • #6
            oceantrader
            Open the builtinADXDM.efs with the Editor and replace the following line

            PHP Code:
            return new Array(vADX.getValue(ADXDMStudy.ADX), vADX.getValue(ADXDMStudy.PDI), vADX.getValue(ADXDMStudy.NDI)); 
            with

            PHP Code:
            return (vADX.getValue(ADXDMStudy.ADX)); 
            That will remove the PDI and NDI plots
            Alex


            Originally posted by oceantrader View Post
            I did it and it works.
            I used the Builtin ADXDM.efs, but now I can't hide the +DI and -DI lines form the indicator, as I do with the Basic Studies when I uncheck the display boxes of +DI and -DI.
            The only thing I was able to do was to change the color of these lines to white (my background color), but the result is not very good because of the many crossovers.

            I need to know how to hide those 2 lines...
            Or to find and ADX.efs with all the function the are in the ADX found in Basic Studies.

            I tried to use the customADXDM.efs, wich is the other ADX efs I found, but it doesn't work, it gives me syntax error.

            Thanks

            Comment


            • #7
              Perfect!
              Thanks everybody you're great.

              Comment


              • #8
                Alex,

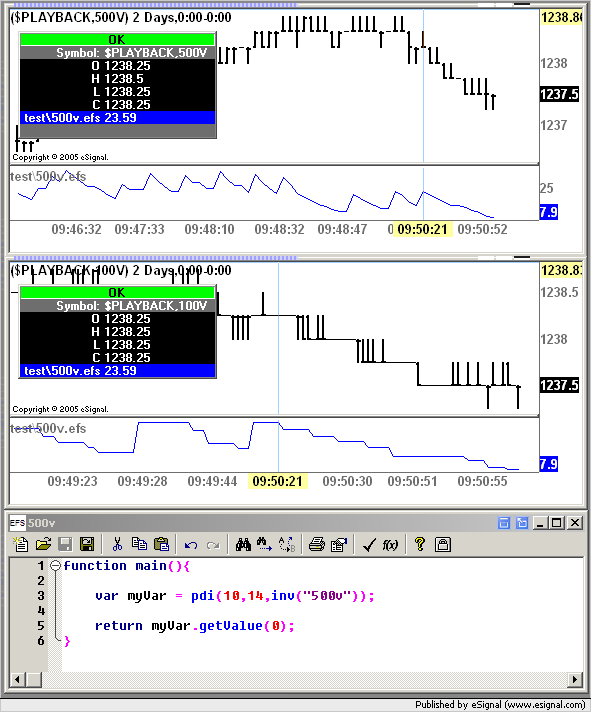
                I am having a problem getting the pdi / ndi values to return anything other than the current chart interval.

                I am not having this problem with any other indicator.

                For example
                cciStudy = cci(14, hlc3(inv("1000v")));
                cciVal = cciStudy.getValue("close", 0);

                works fine even if I am on a 1, 3, or 5 minute chart.

                but the same does not seem to be working for pdi or ndi.

                ndiStudy = pdi(10, 14, inv("500v"));
                ndiVal = ndiStudy.getValue("close", 0);

                No matter what interval I pass it, I seem to only be able to get the current charts interval. Any ideas?

                Thanks

                Comment


                • #9
                  notoad
                  The syntax used to retrieve the value is incorrect in both your examples and should be myVar.getValue(barIndex) where barIndex is the index of the bar you want to retrieve (0 is the current bar, -1 is the prior bar, etc)
                  Alex

                  Comment

                  Working...
                  X