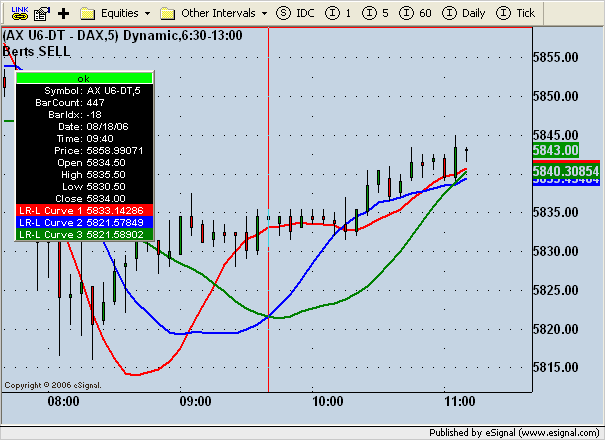
Announcement

Collapse
No announcement yet.

Same Formula used multiple times in EFS

Collapse
This topic is closed.
X
X
 
  • Filter
  • Time
  • Show
Clear All
new posts

  • #16
    Come on, Bert...

    It's not that tricky.

    Comment


    • #17
      Not tricky for you! LOL

      I can define the process but I can't write code.

      Usually when I cut and paste it doesn't work, but at least I can provide some input.

      I can use a wizard but they are limited.

      I can identify the pieces and tell you what the results should be if that will help?

      As a matter of fact I think there may be an error in the logic because of the way I described the process.

      Although it will work the way it's written:

      if( zClose1 < zEMA1 && zClose > zEMA ) {

      if( (zClose > zLRSH1(0) && zClose > zLRSH2(0) ) ||
      (zClose > zLRSH2(0) && zClose > zLRSH3(0) ) ||
      (zClose > zLRSH1(0) && zClose > zLRSH3(0) ) ) {
      tTrade = "GO LONG"

      Close below EMA(20) prior bar and Close above EMA(20) current bar.

      This will greatly limit the number of potential buy signals.

      It should be:
      Buy on "first occurance" of Close above any two green when Close is also above EMA(20).

      Sometimes the close above 2 green comes several bars after the initial close above EMA(20).

      In the prior atteched charts I think you will see what I mean.
      Last edited by OpaBert; 08-02-2006, 08:25 PM.
      OpaBert

      Comment


      • #18
        I'm trying!

        Hi Avery,
        Here's my attempt at trying to merge two EFS's into one.

        It's NOT working... if you / someone could fix it so I can see how to make it work, I can then add the other 5 lines.
        At that point there would be one EFS that visually confirms the basic calculations.

        Then we can go on to tweak the conditional statements and finally back test.

        The ultimate goal is to create an automatic trading system that will interface with an actual trading account!

        Attached is an image of what the intermidiate results should look like when all 7 lines are plotted on a chart.

        I'll also send the EFS's being merged in another post.
        -------------------------------------------------------
        PHP Code:
        //Description This formula was initially generated by the Alert Wizard
        //
        //By eSignal user OpaBert on 8/3/06


        //Declarations

        var bInitialized    false;

        var 
        vEMA20 = new MAStudy(200"Close"MAStudy.EXPONENTIAL);
        var 
        vLastAlert = -1;
        //Declarations


        function preMain() {
           
        /**
            *  This function is called only once, before any of the bars are loaded.
            *  Place any study or EFS configuration commands here.
            */
        //PreMain
            
        setComputeOnClose(true);
            
        setPriceStudy(true);
            
        setStudyTitle("BMM");
            
        setCursorLabelName("EMA20"0);
            
        setCursorLabelName("LR-L Curve"1);    
            
        setDefaultBarStyle(PS_SOLID0);
            
        setDefaultBarStyle(PS_SOLID1);
            
        setDefaultBarFgColor(Color.blue0);
            
        setDefaultBarFgColor(Color.red1);
            
        setDefaultBarThickness(30);
            
        setDefaultBarThickness(21);
            
        setPlotType(PLOTTYPE_LINE0);
            
        setPlotType(PLOTTYPE_LINE1);
            
              
        // Number of Bars before signal is cancelled
            
        var fp1 = new FunctionParameter"frLength"FunctionParameter.NUMBER);
                
        fp1.setName"Length" );
                
        fp1.setLowerLimit(0);
                
        fp1.setDefault(20);
                 
            
        //Line thickness
            
        var fp2 = new FunctionParameter"LineThickness"FunctionParameter.NUMBER); 
                
        fp2.setName"Line thickness" );
                
        fp2.setLowerLimit);
                
        fp2.setUpperLimit10 );
                
        fp2.setDefault);
                
            
        // Filter on Mean Swing Line
            
        var fp3 = new FunctionParameter("LineColor"FunctionParameter.COLOR);
                
        fp3.setName"LineColor" );
                
        fp3.setDefault(Color.red);        

            
        // end of formula paramaters    
            
        }
        //PreMain

           /**
            *  The main() function is called once per bar on all previous bars, once per
            *  each incoming completed bar, and if you don't have 'setComputeOnClose(true)'
            *  in your preMain(), it is also called on every tick.
            */
            
        function main(frLength,LineThickness,LineColor
        {

        //Expressions
            //Expression_1
                
        if (
                    
        vEMA20.getValue(MAStudy.MA, -1) < close(-1) &&
                    
        close() < vEMA20.getValue(MAStudy.MA)
                ) 
        onAction1()
            
        //Expression_1
            
            //Expression_2
                
        else if (
                    
        close(-1) < vEMA20.getValue(MAStudy.MA, -1) &&
                    
        vEMA20.getValue(MAStudy.MA) < close()
                ) 
        onAction2();
            
        //Expression_2
            
        //Expressions


        //Return
            
        return vEMA20.getValue(MAStudy.MA);
        //Return

        }
        {
            var 
        len frLength;
            var 
        vPrice getValue("Low"1, -len);
            var 
        Num1 0.0;
            var 
        Num2 0.0;
            var 
        SumBars len * (len 1) * 0.5;
            var 
        SumSqrBars = (len 1) * len * (len 1) / 6;
            var 
        SumY 0.0;
            var 
        Sum1 0.0;
            var 
        Sum2 0.0;
            var 
        Slope 0.0;
            var 
        Intercept 0.0;
            var 
        0;
            
            
        //script is initializing
            
        if ( getBarState() == BARSTATE_ALLBARS ) {
                
        //return null;
            
        }
            
            
        //initialize once-only paramaters
            
        if ( bInitialized == false ) {
            
                
        setDefaultBarFgColorLineColor);
                
        setDefaultBarThicknessMath.roundLineThickness ), );

                
        bInitialized true;
            }    
            
            for (
        0leni++)
            {
                
        SumY += vPrice[i];
                
        Sum1 += vPrice[i];
            }
            
        Sum2 SumBars SumY;
            
        Num1 len Sum1 Sum2;
            
        Num2 SumBars SumBars len SumSqrBars;
            if (
        Num2 != 0Slope Num1 Num2;
            
        Intercept = (SumY Slope SumBars) / len;
            var 
        LinearRegValue Intercept Slope * (len ); 
            
        //return LinearRegValue;
        }


        function 
        postMain() {

        }
           
        /**
            *  The postMain() function is called only once, when the EFS is no longer used for
            *  the current symbol (ie, symbol change, chart closing, or application shutdown).
            */

        //Actions
            //Action_1
            
        function onAction1() {
                
        setBarBgColor(Color.RGB(255,229,229));
                
        Alert.playSound("C:\\Program Files\\eSignal\\Sounds\\HeadsUp.wav");
                
        vLastAlert 1;
            }
            
        //Action_1
            
            //Action_2
            
        function onAction2() {
                
        setBarBgColor(Color.RGB(212,254,212));
                
        Alert.playSound("C:\\Program Files\\eSignal\\Sounds\\HeadsUp.wav");
                
        vLastAlert 2;
            }
            
        //Action_2
            
        //Actions 
        -------------------------------------------------
        Attached Files
        Last edited by OpaBert; 08-03-2006, 09:39 PM.
        OpaBert

        Comment


        • #19
          Merge EFS

          As you can see I left in the hints generated by the Wizard in hopes that it would help with the merge.

          Attached is the EFS that needs to be fixed.
          Attached Files
          OpaBert

          Comment


          • #20
            EFS Merge

            Here is the EFS that will be merged to plot 6 lines using the same formula but with different parameters.

            You will notice the light green and red bar backgrounds on the intermediate chart.
            They represent just ONE significant condition that might trigger a trade
            or be a prelude to a trade forewarning that other conditions should be watched for.

            The EFS will also give an AUDIO ALERT.
            Attached Files
            Last edited by OpaBert; 08-03-2006, 09:43 PM.
            OpaBert

            Comment


            • #21
              Re: EFS Merge

              When I say "merged to plot 6 lines" what I mean is
              using the same formula / function that plots a single line,
              call it it line_A, based on parameters A,
              I also want to plot line_B based on parameters B,
              and plot line_C based on parameters C, etc. from a single ESF
              rather than use the same EFS several times as I have done to
              produce the sample chart image previously.

              I hope this clears up any question on getting to the intermediate EFS.

              Originally posted by OpaBert
              Here is the EFS that will be merged to plot 6 lines using the
              same formula but with different parameters.

              You will notice the light green and red bar backgrounds on the intermediate chart.
              They represent just ONE significant condition that might trigger a trade
              or be a prelude to a trade forewarning that other conditions should be watched for.

              The EFS will also give an AUDIO ALERT.
              OpaBert

              Comment


              • #22
                Intermediate EFS

                Until an intermediate EFS is done that includes all SEVEN
                conditions / lines in one efs there is no way to backtest and prove
                the expected high number / % of potentially successful trades.

                Once proven, then a method / rules can be developed which could
                lead to a fully automatic trading system.
                Attached Files
                OpaBert

                Comment


                • #23
                  Hello OpaBert,

                  One way to accomplish this task is with the use of efsExternal(). This allows you to use your LR study as many times as you want to create the LR lines with different parameters for each.

                  If you want to take this route, you should modify your lr-l-curve.efs to only perform the LR calculation, or create a second version of it to do this. The formatting of the line(s) will need to be done in the calling efs as that will be the study that can perform the formatting for multiple lines.

                  In the calling EFS, you will set up all the formula parameters in preMain() to specify the different parameters for each LR line you want to plot. This calling EFS will also use those parameters for the formatting. Try the code below and place this study in the same folder as your lr-l-curve.efs. I've also included a modified version of it that just removes the formatting portion.

                  PHP Code:
                  /**************************
                  * Description    : This Indicator plots Linear Regression Curves
                  *

                  Formula requries lr-l-curve.efs to be placed in the same folder as
                  this one.  Otherwise, specify the path to it in the efsExternal() 
                  calls.
                  **************************/


                  function preMain() {
                      
                  setPriceStudy(true);    
                      
                  setStudyTitle("Berts SELL");
                      
                  setCursorLabelName("LR-L Curve 1"0);
                      
                  setCursorLabelName("LR-L Curve 2"1);
                      
                  setCursorLabelName("LR-L Curve 3"2);
                      
                        
                  // Number of Bars before signal is cancelled
                      
                  var fp1 = new FunctionParameter"frLength1"FunctionParameter.NUMBER);
                          
                  fp1.setName"Length 1" );
                          
                  fp1.setLowerLimit(0);
                          
                  fp1.setDefault(20);
                      var 
                  fp1b = new FunctionParameter"frLength2"FunctionParameter.NUMBER);
                          
                  fp1b.setName"Length 2" );
                          
                  fp1b.setLowerLimit(0);
                          
                  fp1b.setDefault(30);
                      var 
                  fp1c = new FunctionParameter"frLength3"FunctionParameter.NUMBER);
                          
                  fp1c.setName"Length 3" );
                          
                  fp1c.setLowerLimit(0);
                          
                  fp1c.setDefault(40);
                           
                      
                  //Line thickness
                      
                  var fp2 = new FunctionParameter"LineThickness1"FunctionParameter.NUMBER); 
                          
                  fp2.setName"Line thickness 1" );
                          
                  fp2.setLowerLimit);
                          
                  fp2.setUpperLimit10 );
                          
                  fp2.setDefault);
                      var 
                  fp2b = new FunctionParameter"LineThickness2"FunctionParameter.NUMBER); 
                          
                  fp2b.setName"Line thickness 2" );
                          
                  fp2b.setLowerLimit);
                          
                  fp2b.setUpperLimit10 );
                          
                  fp2b.setDefault);
                      var 
                  fp2c = new FunctionParameter"LineThickness3"FunctionParameter.NUMBER); 
                          
                  fp2c.setName"Line thickness 3" );
                          
                  fp2c.setLowerLimit);
                          
                  fp2c.setUpperLimit10 );
                          
                  fp2c.setDefault);
                          
                      
                  // Filter on Mean Swing Line
                      
                  var fp3 = new FunctionParameter("LineColor1"FunctionParameter.COLOR);
                          
                  fp3.setName"LineColor 1" );
                          
                  fp3.setDefault(Color.red);        
                      var 
                  fp3b = new FunctionParameter("LineColor2"FunctionParameter.COLOR);
                          
                  fp3b.setName"LineColor 2" );
                          
                  fp3b.setDefault(Color.blue);        
                      var 
                  fp3c = new FunctionParameter("LineColor3"FunctionParameter.COLOR);
                          
                  fp3c.setName"LineColor 3" );
                          
                  fp3c.setDefault(Color.green);        

                      
                  // end of formula paramaters    
                      
                  }

                  var 
                  bInit false;
                  var 
                  xLR1 null;
                  var 
                  xLR2 null;
                  var 
                  xLR3 null;

                  function 
                  main(frLength1frLength2frLength3,
                                
                  LineThickness1LineThickness2LineThickness3
                                
                  LineColor1LineColor2LineColor3) {

                      if (
                  bInit == false) {
                          
                  xLR1 efsExternal("lr-l-curve.efs"frLength1);
                          
                  xLR2 efsExternal("lr-l-curve.efs"frLength2);
                          
                  xLR3 efsExternal("lr-l-curve.efs"frLength3);
                          
                  setDefaultBarFgColorLineColor10);
                          
                  setDefaultBarThicknessMath.roundLineThickness1 ), 0);
                          
                  setDefaultBarFgColorLineColor21);
                          
                  setDefaultBarThicknessMath.roundLineThickness2 ), 1);
                          
                  setDefaultBarFgColorLineColor32);
                          
                  setDefaultBarThicknessMath.roundLineThickness3 ), 2);
                          
                  bInit true;
                      }   
                      
                      return new Array(
                  xLR1.getValue(0), xLR2.getValue(0), xLR3.getValue(0));

                  modified lr-l-curve.efs
                  PHP Code:
                  /**************************
                  * Description    : This Indicator plots the Linear Regression Curve
                  **************************/

                  //Global Variables


                  var bInitialized    false;


                  function 
                  preMain()
                  {
                      
                  setPriceStudy(true);    
                      
                  setStudyTitle("Berts SELL");
                      
                  setCursorLabelName("LR-L Curve");
                      
                        
                  // Number of Bars before signal is cancelled
                      
                  var fp1 = new FunctionParameter"frLength"FunctionParameter.NUMBER);
                          
                  fp1.setName"Length" );
                          
                  fp1.setLowerLimit(0);
                          
                  fp1.setDefault(20);
                           
                      
                  // end of formula paramaters    
                      
                  }

                  function 
                  main(frLength)
                  {
                      var 
                  len frLength;
                      var 
                  vPrice getValue("Low"0, -len);
                      var 
                  Num1 0.0;
                      var 
                  Num2 0.0;
                      var 
                  SumBars len * (len 1) * 0.5;
                      var 
                  SumSqrBars = (len 1) * len * (len 1) / 6;
                      var 
                  SumY 0.0;
                      var 
                  Sum1 0.0;
                      var 
                  Sum2 0.0;
                      var 
                  Slope 0.0;
                      var 
                  Intercept 0.0;
                      var 
                  0;
                      
                      
                  //script is initializing
                      
                  if ( getBarState() == BARSTATE_ALLBARS ) {
                          return 
                  null;
                      }
                      
                      
                  //initialize once-only paramaters
                      
                  if ( bInitialized == false ) {
                      
                          
                  //setDefaultBarFgColor( LineColor, 0);
                          //setDefaultBarThickness( Math.round( LineThickness ), 0);

                          
                  bInitialized true;
                      }    
                      
                      for (
                  0leni++)
                      {
                          
                  SumY += vPrice[i];
                          
                  Sum1 += vPrice[i];
                      }
                      
                  Sum2 SumBars SumY;
                      
                  Num1 len Sum1 Sum2;
                      
                  Num2 SumBars SumBars len SumSqrBars;
                      if (
                  Num2 != 0Slope Num1 Num2;
                      
                  Intercept = (SumY Slope SumBars) / len;
                      var 
                  LinearRegValue Intercept Slope * (len ); 
                      return 
                  LinearRegValue;

                  Jason K.
                  Project Manager
                  eSignal - an Interactive Data company

                  EFS KnowledgeBase
                  JavaScript for EFS Video Series
                  EFS Beginner Tutorial Series
                  EFS Glossary
                  Custom EFS Development Policy

                  New User Orientation

                  Comment


                  • #24
                    Hey JasonK:

                    Thanks for posting the code.

                    My question is what are the deciding factors for coding an internal function vs. external function?

                    I don't really know all of the advantages / disadvantages of each.

                    Perhaps you can provide a list.

                    THANKING YOU IN ADVANCE.

                    Comment


                    • #25
                      Hello Avery,

                      In general, a formula that needs a custom series that is not likely to be used again for other studies can be done within the same study through efsInternal(). It's a little more efficient to use efsInternal(), so if performance is a major factor then use this route. If you have a common series that you want to use with many different studies then you could put the calculation into its own efs and recycle the code for all of the other calling formulas through efsExternal() rather than copy and paste the same efsInternal() function to each study individually. It really depends on the preference of the end user more than anything else.
                      Jason K.
                      Project Manager
                      eSignal - an Interactive Data company

                      EFS KnowledgeBase
                      JavaScript for EFS Video Series
                      EFS Beginner Tutorial Series
                      EFS Glossary
                      Custom EFS Development Policy

                      New User Orientation

                      Comment


                      • #26
                        Same Formula used multiple times

                        Jason,

                        Thanks for posting a way to do this.

                        Unfortunately my ability to program is limited to the "Fourmula Wizard".

                        I can try to cut and paste, so please tell me if I'm on the right track here.

                        To get the 6 LR lines I need I should modify the formula as follows:

                        function preMain() {
                        setPriceStudy(true);
                        setStudyTitle("Berts LR 6");
                        setCursorLabelName("LR-L Curve 1a", 0);
                        setCursorLabelName("LR-L Curve 1b", 1);
                        setCursorLabelName("LR-L Curve 2a", 2);
                        setCursorLabelName("LR-L Curve 2b", 3);
                        setCursorLabelName("LR-L Curve 3a", 4);
                        setCursorLabelName("LR-L Curve 3b", 5);

                        The curve "a" default is HIGH and the "b" default is LOW.

                        Can I use "1a, 1b etc. or do these have to be just numbers, 1,2,3,4,5,6. ?

                        I think I'm getting lost already...
                        OpaBert

                        Comment


                        • #27
                          Hello OpaBert,

                          To add 3 more LRs all you need to do is duplicate all of the code you see for LRs 1, 2 and 3. Just create the variavle names for the new ones with the numbers 4, 5 and 6. Remember also to add the three new LRs to the return array in main(). Give it a shot and if you have any trouble, post your formula code and I'll provide some additional guidance.
                          Jason K.
                          Project Manager
                          eSignal - an Interactive Data company

                          EFS KnowledgeBase
                          JavaScript for EFS Video Series
                          EFS Beginner Tutorial Series
                          EFS Glossary
                          Custom EFS Development Policy

                          New User Orientation

                          Comment

                          Working...
                          X