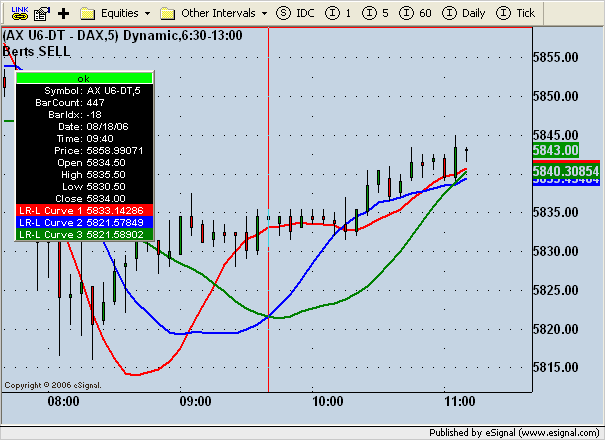
Come on, Bert...
It's not that tricky.
It's not that tricky.


//Description This formula was initially generated by the Alert Wizard

//

//By eSignal user OpaBert on 8/3/06


//Declarations


var bInitialized    = false;


var vEMA20 = new MAStudy(20, 0, "Close", MAStudy.EXPONENTIAL);

var vLastAlert = -1;

//Declarations


function preMain() {

   /**

    *  This function is called only once, before any of the bars are loaded.

    *  Place any study or EFS configuration commands here.

    */

//PreMain

    setComputeOnClose(true);

    setPriceStudy(true);

    setStudyTitle("BMM");

    setCursorLabelName("EMA20", 0);

    setCursorLabelName("LR-L Curve", 1);

    setDefaultBarStyle(PS_SOLID, 0);

    setDefaultBarStyle(PS_SOLID, 1);

    setDefaultBarFgColor(Color.blue, 0);

    setDefaultBarFgColor(Color.red, 1);

    setDefaultBarThickness(3, 0);

    setDefaultBarThickness(2, 1);

    setPlotType(PLOTTYPE_LINE, 0);

    setPlotType(PLOTTYPE_LINE, 1);


      // Number of Bars before signal is cancelled

    var fp1 = new FunctionParameter( "frLength", FunctionParameter.NUMBER);

        fp1.setName( "Length" );

        fp1.setLowerLimit(0);

        fp1.setDefault(20);


    //Line thickness

    var fp2 = new FunctionParameter( "LineThickness", FunctionParameter.NUMBER);

        fp2.setName( "Line thickness" );

        fp2.setLowerLimit( 1 );

        fp2.setUpperLimit( 10 );

        fp2.setDefault( 2 );


    // Filter on Mean Swing Line

    var fp3 = new FunctionParameter("LineColor", FunctionParameter.COLOR);

        fp3.setName( "LineColor" );

        fp3.setDefault(Color.red);


    // end of formula paramaters


}

//PreMain


   /**

    *  The main() function is called once per bar on all previous bars, once per

    *  each incoming completed bar, and if you don't have 'setComputeOnClose(true)'

    *  in your preMain(), it is also called on every tick.

    */


function main(frLength,LineThickness,LineColor)

{


//Expressions

    //Expression_1

        if (

            vEMA20.getValue(MAStudy.MA, -1) < close(-1) &&

            close() < vEMA20.getValue(MAStudy.MA)

        ) onAction1()

    //Expression_1


    //Expression_2

        else if (

            close(-1) < vEMA20.getValue(MAStudy.MA, -1) &&

            vEMA20.getValue(MAStudy.MA) < close()

        ) onAction2();

    //Expression_2


//Expressions


//Return

    return vEMA20.getValue(MAStudy.MA);

//Return


}

{

    var len = frLength;

    var vPrice = getValue("Low", 1, -len);

    var Num1 = 0.0;

    var Num2 = 0.0;

    var SumBars = len * (len - 1) * 0.5;

    var SumSqrBars = (len - 1) * len * (2 * len - 1) / 6;

    var SumY = 0.0;

    var Sum1 = 0.0;

    var Sum2 = 0.0;

    var Slope = 0.0;

    var Intercept = 0.0;

    var i = 0;


    //script is initializing

    if ( getBarState() == BARSTATE_ALLBARS ) {

        //return null;

    }


    //initialize once-only paramaters

    if ( bInitialized == false ) {


        setDefaultBarFgColor( LineColor, 1 );

        setDefaultBarThickness( Math.round( LineThickness ), 1 );


        bInitialized = true;

    }


    for (i = 0; i < len; i++)

    {

        SumY += vPrice[i];

        Sum1 += i * vPrice[i];

    }

    Sum2 = SumBars * SumY;

    Num1 = len * Sum1 - Sum2;

    Num2 = SumBars * SumBars - len * SumSqrBars;

    if (Num2 != 0) Slope = Num1 / Num2;

    Intercept = (SumY - Slope * SumBars) / len;

    var LinearRegValue = Intercept + Slope * (len - 1 );

    //return LinearRegValue;

}


function postMain() {


}

   /**

    *  The postMain() function is called only once, when the EFS is no longer used for

    *  the current symbol (ie, symbol change, chart closing, or application shutdown).

    */


//Actions

    //Action_1

    function onAction1() {

        setBarBgColor(Color.RGB(255,229,229));

        Alert.playSound("C:\\Program Files\\eSignal\\Sounds\\HeadsUp.wav");

        vLastAlert = 1;

    }

    //Action_1


    //Action_2

    function onAction2() {

        setBarBgColor(Color.RGB(212,254,212));

        Alert.playSound("C:\\Program Files\\eSignal\\Sounds\\HeadsUp.wav");

        vLastAlert = 2;

    }

    //Action_2


//Actions

/**************************

* Description    : This Indicator plots Linear Regression Curves

*


Formula requries lr-l-curve.efs to be placed in the same folder as

this one.  Otherwise, specify the path to it in the efsExternal()

calls.

**************************/


function preMain() {

    setPriceStudy(true);

    setStudyTitle("Berts SELL");

    setCursorLabelName("LR-L Curve 1", 0);

    setCursorLabelName("LR-L Curve 2", 1);

    setCursorLabelName("LR-L Curve 3", 2);


      // Number of Bars before signal is cancelled

    var fp1 = new FunctionParameter( "frLength1", FunctionParameter.NUMBER);

        fp1.setName( "Length 1" );

        fp1.setLowerLimit(0);

        fp1.setDefault(20);

    var fp1b = new FunctionParameter( "frLength2", FunctionParameter.NUMBER);

        fp1b.setName( "Length 2" );

        fp1b.setLowerLimit(0);

        fp1b.setDefault(30);

    var fp1c = new FunctionParameter( "frLength3", FunctionParameter.NUMBER);

        fp1c.setName( "Length 3" );

        fp1c.setLowerLimit(0);

        fp1c.setDefault(40);


    //Line thickness

    var fp2 = new FunctionParameter( "LineThickness1", FunctionParameter.NUMBER);

        fp2.setName( "Line thickness 1" );

        fp2.setLowerLimit( 1 );

        fp2.setUpperLimit( 10 );

        fp2.setDefault( 2 );

    var fp2b = new FunctionParameter( "LineThickness2", FunctionParameter.NUMBER);

        fp2b.setName( "Line thickness 2" );

        fp2b.setLowerLimit( 1 );

        fp2b.setUpperLimit( 10 );

        fp2b.setDefault( 2 );

    var fp2c = new FunctionParameter( "LineThickness3", FunctionParameter.NUMBER);

        fp2c.setName( "Line thickness 3" );

        fp2c.setLowerLimit( 1 );

        fp2c.setUpperLimit( 10 );

        fp2c.setDefault( 2 );


    // Filter on Mean Swing Line

    var fp3 = new FunctionParameter("LineColor1", FunctionParameter.COLOR);

        fp3.setName( "LineColor 1" );

        fp3.setDefault(Color.red);

    var fp3b = new FunctionParameter("LineColor2", FunctionParameter.COLOR);

        fp3b.setName( "LineColor 2" );

        fp3b.setDefault(Color.blue);

    var fp3c = new FunctionParameter("LineColor3", FunctionParameter.COLOR);

        fp3c.setName( "LineColor 3" );

        fp3c.setDefault(Color.green);


    // end of formula paramaters


}


var bInit = false;

var xLR1 = null;

var xLR2 = null;

var xLR3 = null;


function main(frLength1, frLength2, frLength3,

              LineThickness1, LineThickness2, LineThickness3,

              LineColor1, LineColor2, LineColor3) {


    if (bInit == false) {

        xLR1 = efsExternal("lr-l-curve.efs", frLength1);

        xLR2 = efsExternal("lr-l-curve.efs", frLength2);

        xLR3 = efsExternal("lr-l-curve.efs", frLength3);

        setDefaultBarFgColor( LineColor1, 0);

        setDefaultBarThickness( Math.round( LineThickness1 ), 0);

        setDefaultBarFgColor( LineColor2, 1);

        setDefaultBarThickness( Math.round( LineThickness2 ), 1);

        setDefaultBarFgColor( LineColor3, 2);

        setDefaultBarThickness( Math.round( LineThickness3 ), 2);

        bInit = true;

    }


    return new Array(xLR1.getValue(0), xLR2.getValue(0), xLR3.getValue(0));

}
/**************************

* Description    : This Indicator plots the Linear Regression Curve

**************************/


//Global Variables


var bInitialized    = false;


function preMain()

{

    setPriceStudy(true);

    setStudyTitle("Berts SELL");

    setCursorLabelName("LR-L Curve");


      // Number of Bars before signal is cancelled

    var fp1 = new FunctionParameter( "frLength", FunctionParameter.NUMBER);

        fp1.setName( "Length" );

        fp1.setLowerLimit(0);

        fp1.setDefault(20);


    // end of formula paramaters


}


function main(frLength)

{

    var len = frLength;

    var vPrice = getValue("Low", 0, -len);

    var Num1 = 0.0;

    var Num2 = 0.0;

    var SumBars = len * (len - 1) * 0.5;

    var SumSqrBars = (len - 1) * len * (2 * len - 1) / 6;

    var SumY = 0.0;

    var Sum1 = 0.0;

    var Sum2 = 0.0;

    var Slope = 0.0;

    var Intercept = 0.0;

    var i = 0;


    //script is initializing

    if ( getBarState() == BARSTATE_ALLBARS ) {

        return null;

    }


    //initialize once-only paramaters

    if ( bInitialized == false ) {


        //setDefaultBarFgColor( LineColor, 0);

        //setDefaultBarThickness( Math.round( LineThickness ), 0);


        bInitialized = true;

    }


    for (i = 0; i < len; i++)

    {

        SumY += vPrice[i];

        Sum1 += i * vPrice[i];

    }

    Sum2 = SumBars * SumY;

    Num1 = len * Sum1 - Sum2;

    Num2 = SumBars * SumBars - len * SumSqrBars;

    if (Num2 != 0) Slope = Num1 / Num2;

    Intercept = (SumY - Slope * SumBars) / len;

    var LinearRegValue = Intercept + Slope * (len - 1 );

    return LinearRegValue;

}


Comment