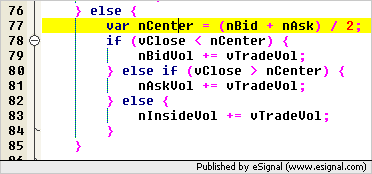
I have had very good results using the bid/ask volume study found here:
The problem is that when trading highly volatile low float stocks, most trades are inbetween the bid/ask; which are represented by the black line in the study.
I would like the following modifications:
1. If the trade happens inside the bid/ask price, then display it as ask if it's closer to the ask price, or display it as a bid if closer to the bid price. If it falls in right in the middle, then make it black.
2. Apply the same as #1 above to trades outside of the bid/ask price. If higher than ask, then display as ask. If below bid, display as a bid.
I'm a beginner to efs and can't write Java. However, I am computer literate and may be able to figure it out if I buy a Java book. Is what I'm asking very difficult to do? Can anyone point me to the right direction?
If anyone can help with the above, I'm forever indebted to you!


Comment