Announcement

Collapse
No announcement yet.

MA Extension Rays

Collapse
X
 
  • Filter
  • Time
  • Show
Clear All
new posts

  • #16
    Hi Glenn,

    Thanks for the discussion and the humor, I enjoy that. The link was interesting too, an interesting perspective on our society and the choices we make.

    I will try and lay this out better. First, here is the location of the original studies we are talking about...


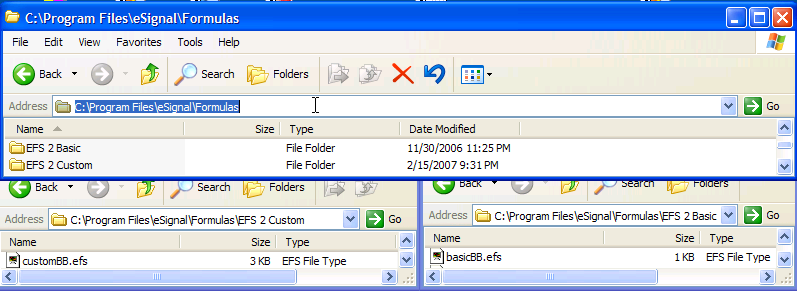
    As you can see, the one you were using was from the EFS2 Basic folder. The one I grabbed for modification was from the EFS2 Custom folder.

    Please note that I did not write the original efs nor did I construct the interface that allowed you to change the parameters so easily. This is a very nicely structured efs. I purposely added only those steps that were required for the functionality you wanted. Adding additional steps would have only added more confusion to this in my opinion.

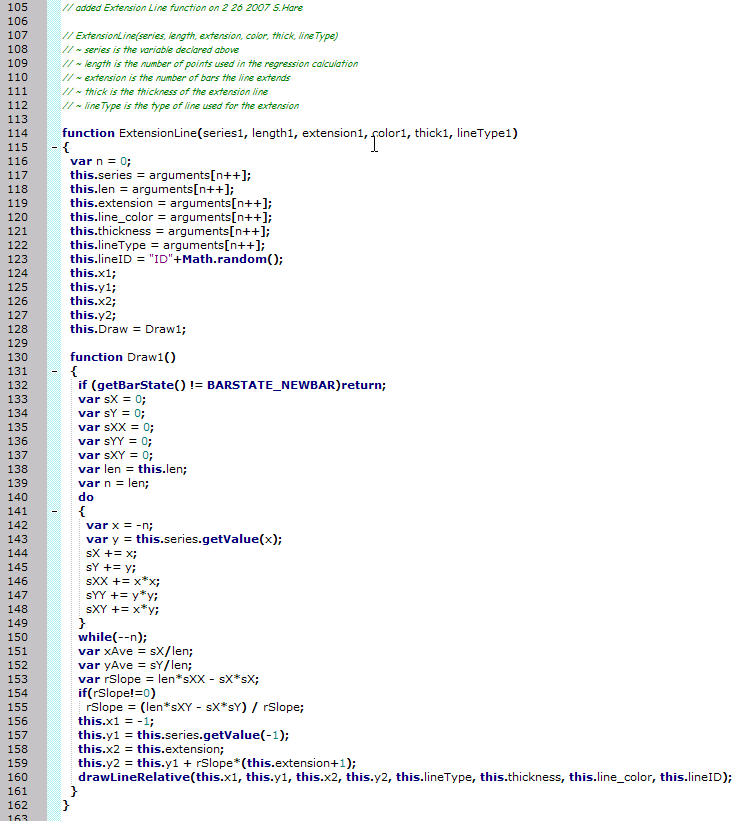
    Here is a pic of the function that I added to the CustomBB.efs as noted by my annotation in the comment in line 105 ...


    Now, I zoomed in on the comments so that we can see them without a magnifying glass (lines 105 through 112).


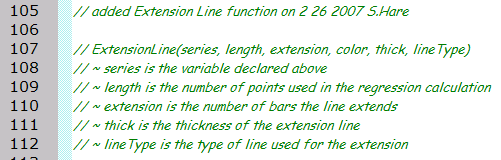
    I put this here as it was my attempt to provide a legend of what the different arguments are when you call this function. You will see that line 109 represents the regression length. Remember, these lines are all comments.


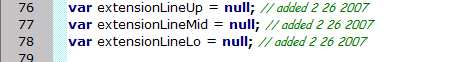
    Now, here is where I declared the variables that I would be using at a later time to declare instances of this function (lines 76,77 and 78).
    By defining them outside of any function, they are said to be declared in the global scope. As such, they will retain their values every time the chart calls the main() function. Details as to how global variables and main() works are contained in the tutorials.


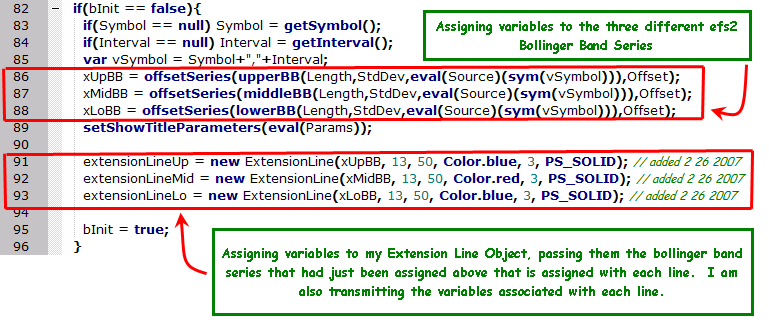
    Now here is where we actually setup the efs to create the series objects. We use the different global variables that were previously declared. They will retained their settings throughout the life of this efs (unless deliberatly modified). Lines 82 through 96 are run when the efs is initially loaded onto a chart. This is controlled by the bInit variable that was initially declared as a global variable and set to false. Once this conditional is stepped through, the global variable bInit is set to true, preventing the steps within the conditional from being run another time.

    Please note that I added the steps in lines 91, 92 and 93. The way I set these up in the function I wrote was that these would be distinct objects associated with the upper middle and lower bollinger band series already declared in lines 86, 87 and 88. These variables are assigned to an object that also saves the parameters you are sending in these steps.

    I tried to explain what the different assignments that are made in this section via the annotations in the image. To answer your question directly, change the second argument from 13 to 2 in the object declarations in lines 91, 92 and 93.


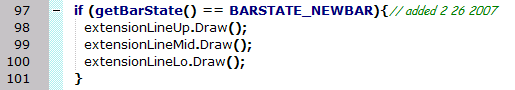
    Finally, here is the section of the code that calls a function that is contained within the object that was declared in the steps above. These steps are the ones that, in effect, draw the lines on the chart at the beginning of a new bar.


    I hope this helps.
    Last edited by ; 02-28-2007, 06:47 PM.

    Comment


    • #17
      Bravo !!!

      Hi Steve,

      Thanks for the line by line explanation. I did the edit to 2. That's It !

      Glad you liked the cargo cult story.

      I'll be spending some time going through the code line by line with the manuals.

      This will really help, quite a lot actually. Guess that'll do it for now.

      Very Best Regards,

      Glenn
      San Mateo

      Comment


      • #18
        Hi Glenn,

        You are most welcome. Good to hear this worked out.

        Comment


        • #19
          Non regressed extention

          Hi Steve,

          I've been working with this on and off for awhile.
          I haven't much to show for the effort, guess I'm
          programmed challenged. I was wondering if you could
          help me out a little more.

          Perhaps if you just do a moving average extension,
          I might be to adjust it for my Bollinger Bands.

          Here's what I'm after; say the 15 minute moving
          average on the 1 minute chart as an example.

          Draw an extension line from the n = -1 value
          through the n = 0 value. The line would update
          in real time as the current, 0 bar moves.

          From where I left off before, this would help quite
          a bit for the short time frame moving averages
          and bands that I use along with the longer time frames.

          Best Regards,

          Glenn
          San Mateo, CA

          Comment


          • #20
            Hi Glenn,

            To update in real time, a regression calculation is unecessary. A drawLineRelative command would be sufficient. Post your code and I will insert that line in for you.

            Comment


            • #21
              Doh !

              Hi Steve,

              I had a feeling you were going to write something like that.
              I tried a few times altering code that was already in place, didn't get very far. But since I have very little pride with regard to this sort of thing, the crud is listed below.

              How about if I go back again and really try. I'll get back to you later after I flounder a bit more. The thing that is frustrating for me is I do know this will be a rather trivial bit of code. Don't laugh too hard ...


              debugPrintln( "The current value is: " );

              setStudyTitle ("000 1 015 GTEST"); // Display Study Title
              //setPriceStudy (true); // Display Results On Price Chart

              var myStudy1 = null;
              var myStudy2 = null;
              var myStudy3 = null;
              var bInit = false;

              function main() {
              var myVar1;
              var myVar11;
              var myVar2;
              var myVar3;

              if ( bInit == false ) {

              myStudy1 = sma( 10 );
              myStudy2 = sma( 20 );
              myStudy3 = sma( 30 );

              bInit = true;

              }

              //retrieve values
              myVar1 = myStudy1.getValue(0);
              myVar11 = myStudy1.getValue(-1);

              debugClear();
              debugPrintln( "The current value is: " + myVar1(0) );
              //("myVar1, myVar11");


              myVar2 = myStudy2.getValue(0);
              myVar3 = myStudy3.getValue(0);

              return new Array( myVar1, myVar2, myVar3 );

              }

              Comment


              • #22
                Arrgh

                Hello Again Steve,

                The first set of crud, 000 1 015 GTEST, shows my further suffering. I think I'm a little closer because I can see a few specks of white underneath the blue fron n= -1 to n = 0.

                In my alteration, of Test 1 015 ( Dogs and cats get altered too ? ), I can vaugely see the extension length made within the regression of the xMA = offsetseries call.

                But now I'm now clueless ... again.

                If it's any consolation, I had a check ride pilot instructor tell me once that I have a good feel for the machinery. I have pretty good eye hand coordination and my landings are much better than the shtuf that follows, newVar Shtuf = dodoo

                Best Regards,

                Glenn

                PS
                I Just spotted this, is it something worthwhile ?

                clearLineTool(LineTool.RAY);//clear all the LineTool.RAY
                addLineTool(LineTool.RAY,-1,nMA_1,0,nMA_0,1,Color.blue,"Ray");//add the LineTool.RAY


                setStudyTitle ("000 1 015 GTEST"); // Display Study Title
                setPriceStudy (true); // Display Results On Price Chart

                var myStudy1 = null;
                var myStudy2 = null;
                var myStudy3 = null;
                var bInit = false;

                function main() {
                var myVar1;
                var myVar2;
                var myVar3;

                if ( bInit == false ) {

                myStudy1 = sma( 10 );
                // myStudy2 = sma( 20 );
                // myStudy3 = sma( 30 );

                bInit = true;

                }

                //retrieve values
                myVar1 = myStudy1.getValue(0);
                myVar2 = myStudy1.getValue(-1);

                drawLineRelative(-1, myVar2, 0, myVar1, PS_SOLID, 1, Color.white, "TagName")

                //return new Array( myVar1, myVar2, myVar3 );


                /************************************************** *******
                By Alexis C. Montenegro for eSignal © December 2004
                Use and/or modify this code freely. If you redistribute it
                please include this and/or any other comment blocks and a
                description of any changes you make.

                added Extension Line function on 2 25 2007 S.Hare
                ************************************************** ********/

                var fpArray = new Array();

                function preMain() {

                setPriceStudy (true); // Display Results On Price Chart
                setStudyTitle ("Test 1 015"); // Display Study Title
                setCursorLabelName ("MA",0); // Returned Data Series Name, 0 is First, there actually could be more
                setDefaultBarFgColor (Color.lime,0); // Set Default Color Start at bar 0
                setPlotType (PLOTTYPE_LINE,0); // Set default to line plt start at 0
                setDefaultBarThickness (1,0); // Set Default thickness start at bar 0
                askForInput ();

                var x=0;
                fpArray[x] = new FunctionParameter("Type", FunctionParameter.STRING);
                with (fpArray[x++]){
                addOption ("sma");
                addOption ("ema");
                addOption ("wma");
                addOption ("vwma");
                setDefault ("vwma");
                }
                fpArray[x] = new FunctionParameter("Length", FunctionParameter.NUMBER); // Regression Length ?
                with (fpArray[x++]){
                setLowerLimit (1);
                setDefault (10);
                }
                fpArray[x] = new FunctionParameter("Source", FunctionParameter.STRING);
                with (fpArray[x++]){
                addOption ("open");
                addOption ("high");
                addOption ("low");
                addOption ("close");
                addOption ("hl2");
                addOption ("hlc3");
                addOption ("ohlc4");
                setDefault ("hl2"); // was close
                }
                fpArray[x] = new FunctionParameter("Symbol", FunctionParameter.STRING);
                with (fpArray[x++]){
                setDefault ();
                }
                fpArray[x] = new FunctionParameter("Interval", FunctionParameter.STRING);
                with (fpArray[x++]){
                setDefault ();
                }
                fpArray[x] = new FunctionParameter("Offset", FunctionParameter.NUMBER);
                with (fpArray[x++]){
                setDefault (0);
                }
                fpArray[x] = new FunctionParameter("Params", FunctionParameter.BOOLEAN);
                with (fpArray[x++]){
                setName ("Show Parameters");
                setDefault (false);
                }
                }

                var bInit = false;
                var xMA = null;
                var extensionLine = null; // added 2 25 2007 S.Hare
                var extensionLine1 = null; // added 2 25 2007 S.Hare

                function main(Type,Length,Source,Symbol,Interval,Offset,Par ams) {
                // Length is Regression Length
                if (bInit == false){

                if(Symbol == null) Symbol = getSymbol();
                if(Interval == null) Interval = getInterval();
                var vSymbol = Symbol+","+Interval;

                xMA = offsetSeries(eval(Type)(Length,eval(Source)(sym(vS ymbol))),Offset);
                // extensionLine = new ExtensionLine(xMA, Length, 15, Color.blue, 2, PS_SOLID); // added 2 25 2007 S.Hare
                extensionLine1 = new ExtensionLine(xMA, 2, 5, Color.lime, 1, PS_SOLID); // added 2 25 2007 S.Hare
                // 2 is regression length, 5 is extension length actually drawn
                setShowTitleParameters(eval(Params));
                bInit = true;
                }
                if (getBarState() == BARSTATE_NEWBAR){// added 2 25 2007 S.Hare
                // extensionLine.Draw();
                extensionLine1.Draw();
                }

                return getSeries(xMA);
                }

                // added Extension Line function on 2 25 2007 S.Hare
                function ExtensionLine(series1, length1, extension1, color1, thick1, lineType1)
                {
                var n = 0;
                this.series = arguments[n++];
                this.len = arguments[n++];
                this.extension = arguments[n++];
                this.line_color = arguments[n++];
                this.thickness = arguments[n++];
                this.lineType = arguments[n++];
                this.lineID = "ID"+Math.random();
                this.x1;
                this.y1;
                this.x2;
                this.y2;
                this.Draw = Draw1;

                function Draw1()
                {
                if (getBarState() != BARSTATE_NEWBAR) return;
                var sX = 0;
                var sY = 0;
                var sXX = 0;
                var sYY = 0;
                var sXY = 0;
                var len = this.len;
                var n = len;
                do
                {
                var x = -n;
                var y = this.series.getValue(x);
                sX += x;
                sY += y;
                sXX += x*x;
                sYY += y*y;
                sXY += x*y;
                }
                while (--n);
                var xAve = sX/len;
                var yAve = sY/len;
                var rSlope = len*sXX - sX*sX;

                if(rSlope!=0)
                rSlope = (len*sXY - sX*sY) / rSlope;
                this.x1 = -1;
                this.y1 = this.series.getValue(-1);
                this.x2 = this.extension;
                this.y2 = this.y1 + rSlope*(this.extension+1);

                drawLineRelative(this.x1, this.y1, this.x2, this.y2, this.lineType, this.thickness, this.line_color, this.lineID);
                }
                }

                Comment


                • #23
                  Glenn,

                  Here is a rewrite of your code, there were several issues with your efs that prevented it from working as you wanted, the most significant being this line

                  debugPrintln( "The current value is: " + myVar1(0) );

                  You referred to the variable as you would a function or method... when it was assigned numerical value in this line ...

                  myVar1 = myStudy1.getValue(0);

                  This efs works as is and as you requested,
                  Draw an extension line from the n = -1 value through the n = 0 value. The line would update in real time as the current, 0 bar moves.
                  and extends the line 50 bars into the future. This extension value may be modified by editing this number where it appears in the drawLineRelative() command.

                  Hope this helps get you where you want to go.

                  PHP Code:
                  debugClear();
                  debugPrintln"The current value is: " ); 

                  var 
                  myStudy1 null
                  var 
                  myStudy2 null
                  var 
                  myStudy3 null
                  var 
                  bInit false

                  function 
                  preMain() {
                   
                  setPriceStudy(true);
                   
                  setStudyTitle ("000 1 015 GTEST");
                   
                  setCursorLabelName("Var1"0);
                   
                  setCursorLabelName("Var2"1);
                   
                  setCursorLabelName("Var3"2);
                   
                  setDefaultBarFgColor(Color.blue0);
                   
                  setDefaultBarFgColor(Color.red1);
                   
                  setDefaultBarFgColor(Color.blue2);
                   
                  setPlotType(PLOTTYPE_LINE,0);
                   
                  setPlotType(PLOTTYPE_LINE,1);
                   
                  setPlotType(PLOTTYPE_LINE,2);
                   
                  setDefaultBarThickness(1,0);
                   
                  setDefaultBarThickness(1,1);
                   
                  setDefaultBarThickness(1,2);
                  }

                  function 
                  main() { 
                   var 
                  myVar1;
                   var 
                  myVar11
                   var 
                  myVar2
                   var 
                  myVar3

                   if ( 
                  bInit == false ) { 
                    
                  myStudy1 sma10 ); 
                    
                  myStudy2 sma20 ); 
                    
                  myStudy3 sma30 ); 
                    
                  bInit true
                   } 

                   
                  //retrieve values 
                   
                  myVar1 myStudy1.getValue(0);
                   
                  myVar11 myStudy1.getValue(-1); 
                   
                  drawLineRelative(-1myVar1150, (myVar1+50*(myVar1-myVar11)), PS_SOLID3Color.blue"line1" );
                   
                  debugPrintln"The current value is: " myVar1 ); 

                   
                  myVar2 myStudy2.getValue(0); 
                   
                  myVar3 myStudy3.getValue(0); 

                   return new Array( 
                  myVar1myVar2myVar3 ); 

                  FWIW, the code I previously posted a link to was a complete efs that worked as-is . The intent was that the function was generic enough that you could use it with any number or type of eSignal Series, although I recommended that you limit the line drawing to every new bar (and wrote it this way). Perhaps you will yet find a use for it.

                  Comment


                  • #24
                    Thanks !!!

                    Hi Steve,

                    That's it precisely. I'll see about making the alterations for the way I use John Bollinger's bands in the different time frames I observe. I think I should be able to accomplish that.

                    Please know that I have been using the code you provided for me ever since I initially asked for your help.

                    It's interesting, the counter shows that there have been at least a few other people taking a look at this thread as well.

                    Thanks again, Very Much !

                    Glenn
                    San Mateo, CA

                    Comment


                    • #25
                      Glenn,

                      You are welcome, good to hear that helps.

                      Comment


                      • #26
                        Many Thanks

                        Hi Steve,

                        When I was in college I found out rather conclusively that I was one of those guys smart enough to know I'm no genius. The phrase I've heard before is trainable monkey, yeah, that's it.

                        Good news, I was able - trivial task in comparison to the code you do - to get things set exactly the way I've wanted with John Bollinger's Bands.

                        Thank You So Very Much. If you're ever near E-Signal's HQ in Hayward, let me know if you'd like to do a Bay tour from the air. Although, Cessna's really aren't that fast.

                        Best Regards,

                        Glenn
                        San Mateo, CA

                        Comment

                        Working...
                        X