Announcement

Collapse
No announcement yet.

ADX and $TRIN color study

Collapse
X
 
  • Filter
  • Time
  • Show
Clear All
new posts

  • ADX and $TRIN color study

    Hello,

    I remember it was possible to color the background of the graph based on a formula but I can't remember how this was done (probably something in the Premain() ).

    Can someone show me an example of the function? Say for example a study that would color the background in gray when ADX<17, in green when ADX >17 and $TRIN<1 and in red when ADX>17 and $TRIN>1

    Thanks

  • #2
    Matt
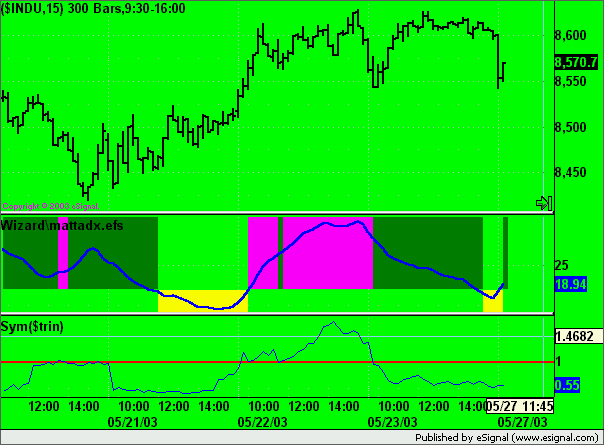
    I was not sure what background you wanted painted ie whether the chart background or only the indicator's background so I did both with an additional option
    In the attached efs if the ADX is <17 the whole chart background is gray and the section of the adx that is under 17 is painted yellow.


    If the ADX is above 17 and $TRIN is less than 1 the chart background is lime and the section of the adx above 17 is green.


    Lastly if the ADX is above 17 and $TRIN is greater than 1 the background is red and the section of the adx above 17 is magenta (image not shown)

    In the images $TRIN is plotted using another efs.
    Explanations on how to paint the sections of the indicator are in the efs itself.
    Also in the efs is an alternative to paint the whole height of the indicator instead of just a section.
    I hope this covers all the bases.
    Alex
    Attached Files
    Last edited by ACM; 06-04-2003, 08:47 PM.

    Comment


    • #3
      Thanks Alex for your help, I really appreciate it !

      Comment


      • #4
        Alex,

        I tried your script and the bar background is always Lime whatever the symbol, interval I put (i use 7.4 beta 1) .

        I checked the code, setChartBG, the function I was looking for, was properly used.

        Even if your screenshots, when the indicator is magenta, the screen is still lime where it should be red...

        Maybe we need to use the strategy functions in order for the EFS to change the background color ???

        Matt

        Comment


        • #5
          Matt
          No I don't believe that is necessary.
          I think the issue is related to how I am referencing $TRIN in the script which may be skewing results unless it is in real time (and the Time Template is set to NYSE session) or is the symbol used in the chart when in Replay mode.
          In fact as an experiment try using $TRIN in your chart and you should see that in Replay it will give you the correct results (see image).


          Anyhow I will run the script during today's trading session to see if it behaves correctly.
          For another example on painting the background you may want to try the script in this thread.
          Alex

          Comment


          • #6
            Matt
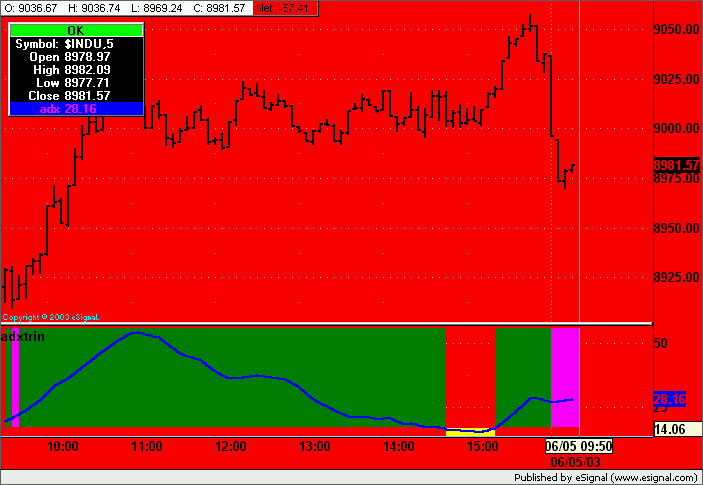
            FWIW it now seems to be working in real time.
            Here is a 5 minute chart with $INDU as the main symbol
            Alex

            Comment

            Working...
            X