Hello,
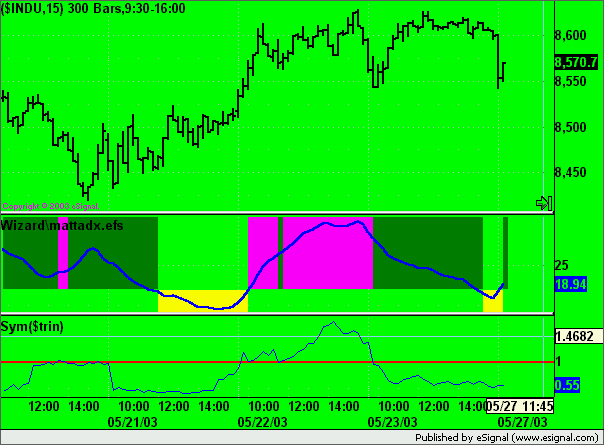
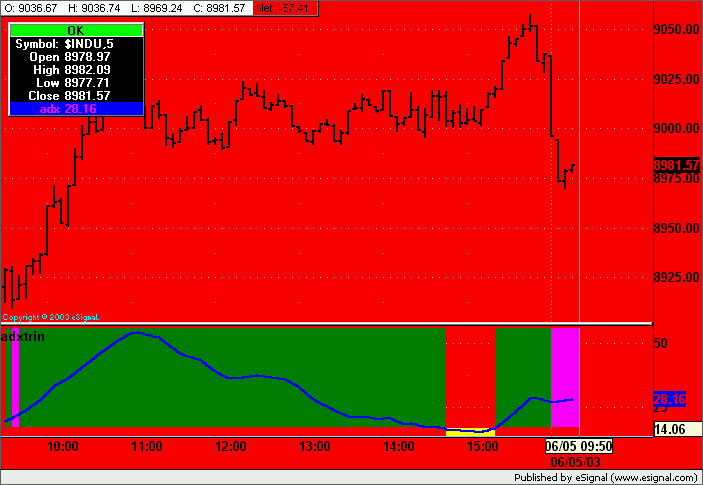
I remember it was possible to color the background of the graph based on a formula but I can't remember how this was done (probably something in the Premain() ).
Can someone show me an example of the function? Say for example a study that would color the background in gray when ADX<17, in green when ADX >17 and $TRIN<1 and in red when ADX>17 and $TRIN>1
Thanks


Comment