Announcement

Collapse
No announcement yet.

Ichimoku

Collapse
X
 
  • Filter
  • Time
  • Show
Clear All
new posts

  • ACM
    replied
    Ray

    the least they can do for me is to post a canned formula that works correctly
    .....as it is supposed to....
    Based on my understanding of the Ichimoku study the formula you are referencing is working correctly.
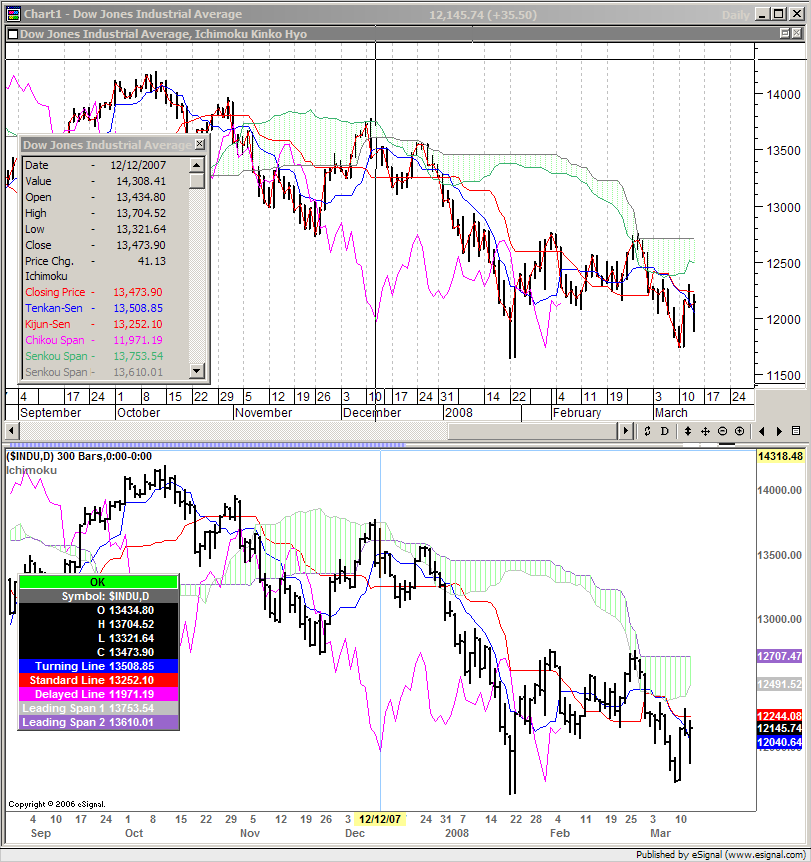
    I also checked it against the values returned by some other applications (Metastock to name one) and the results are virtually identical apart for some marginal differences probably due to the underlying data. Enclosed below is a screenshot showing the Ichimoku study in Metastock and in eSignal. As a an aside note that also in Metastock the Ichimoku study only plots up to the last bar.

    I'm assuming you do not work for eSignal ....
    That is correct.
    Alex


    Originally posted by raykohl
    Alex,
    Thanks for your reply.

    Realize that you are dealing with a "Technical Moron" here..... ME! ...... ( and an old one I might add ).

    I have no desire to learn efs.....It is totally Greek to me.

    My thinking is that since I pay eSignal, and pay them well,
    the least they can do for me is to post a canned formula that works correctly
    .....as it is supposed to....
    otherwise why put it here in the first place !!!
    This is not some obscure study...... half the currency traders in the world use it.

    I'm assuming you do not work for eSignal ....
    Thank you so much for your time and help
    .... I do appreciate that.

    Regards
    Ray
    .

    Leave a comment:


  • rgarg99
    replied
    Once again I agree with raykohl on all counts.... I am a active hedge fund trader that uses esignal in many instances for alerts.. but their Ichimoku and Heikin- Ashi charts are bogus. (no disrespect to the programmers but in both instances they are poorly created. I do not know how to program either by the way. Over the 10 years I have been an esignal client, I have made many suggestions that they have acted on. I hope that they create their own versions of these fantastic trading indicators.

    bob

    Leave a comment:


  • raykohl
    replied
    Offset Cloud

    Alex,
    Thanks for your reply.

    Realize that you are dealing with a "Technical Moron" here..... ME! ...... ( and an old one I might add ).

    I have no desire to learn efs.....It is totally Greek to me.

    My thinking is that since I pay eSignal, and pay them well,
    the least they can do for me is to post a canned formula that works correctly
    .....as it is supposed to....
    otherwise why put it here in the first place !!!
    This is not some obscure study...... half the currency traders in the world use it.

    I'm assuming you do not work for eSignal ....
    Thank you so much for your time and help
    .... I do appreciate that.

    Regards
    Ray
    .
    Last edited by raykohl; 03-13-2008, 04:31 PM.

    Leave a comment:


  • ACM
    replied
    raykohl
    The cloud is actually displaced forward by 26 periods (ie the values of the cloud are based on the data of 26 bars back) however because an efs does not plot if there are no price bars you simply don't get the portion of the cloud that goes beyond the most recent (ie last) bar. In order to see that portion of the cloud you would have to modify the script to draw it rather than plot it. You can find a basic example of the logic required to draw lines past the last bar in this thread.
    If - as you indicate - you are unfamiliar with programming in EFS and are interested in learning then you may want to start by reviewing the JavaScript for EFS video series and the Core JavaScript Reference Guide. Those will provide you with a thorough introduction to programming in JavaScript which is at the foundation of EFS. Then go through the EFS KnowledgeBase and study the Help Guides and Tutorials which will provide you with the specifics of EFS.
    If instead you are seeking for someone to develop the script for you then you may want to review the FAQ: How can I get my custom study built
    Alex


    Originally posted by raykohl
    Hi,

    I have the efs study of Ichimoku charts up ... but..
    it does not show the chart correctly....at least as I understand that it should be displayed.

    The "CLOUD" should be shown displaced forward of price by 26 periods.
    In my charts it just shows the Cloud as even with the price.

    The many chart examples I have seen in books -
    show the Cloud as displace forward (as is correct).
    I'd like to get mine to do the same.

    I don't know zip about EFS, or how to change it....

    Help would be appreciated.

    Leave a comment:


  • rgarg99
    replied
    you are absoltely right. I notified esignal about this many times..it is a shame that they even allowed it to be given out to subcribers in this form. I have suggested that esignal program their own version. Lets hope they do

    Leave a comment:


  • raykohl
    started a topic Ichimoku

    Ichimoku

    Hi,

    I have the efs study of Ichimoku charts up ... but..
    it does not show the chart correctly....at least as I understand that it should be displayed.

    The "CLOUD" should be shown displaced forward of price by 26 periods.
    In my charts it just shows the Cloud as even with the price.

    The many chart examples I have seen in books -
    show the Cloud as displace forward (as is correct).
    I'd like to get mine to do the same.

    I don't know zip about EFS, or how to change it....

    Help would be appreciated.
    Last edited by raykohl; 03-08-2008, 08:53 PM.
Working...
X