Announcement

Collapse
No announcement yet.

Ichimoku chart lines

Collapse
X
 
  • Filter
  • Time
  • Show
Clear All
new posts

  • Ichimoku chart lines

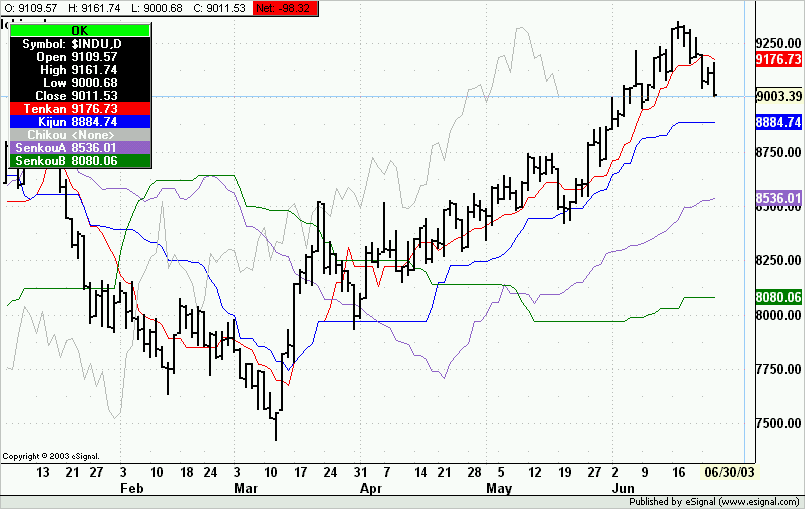
    I was wondering if it were possible to write these five lines so they can plot on an Advanced Chart...


    (this is from a website)

    Calculation

    The Ichimoku chart consists of five lines and the calculation of these five lines involves only taking the midpoints of previous highs and lows, similar to the Moving Average studies. Even with its simplicity, the completed chart is able to present a clear perspective into the price action of the security at hand.
    The five lines are calculated as follows:

    1) Tenkan-Sen = Conversion Line = (Highest High + Lowest Low) / 2, for the past 9 periods

    2) Kijun-Sen = Base Line = (Highest High + Lowest Low) / 2, for the past 26 periods

    3) Chikou Span = Lagging Span = Today's closing price plotted 26 periods behind

    4) Senkou Span A = Leading Span A = (Tenkan-Sen + Kijun-Sen) / 2, plotted 26 periods ahead

    5) Senkou Span B = Leading Span B = (Highest High + Lowest Low) / 2, for the past 52 periods, plotted 26 periods ahead
  • #2
    Dave
    I believe the attached efs plots the complete Ichimoku study
    Alex

    Attached Files

    Comment


    • #3
      Alex,

      That's it. Your work is very appreciated. Thanks.

      Dave

      Comment


      • #4
        ichimoku future

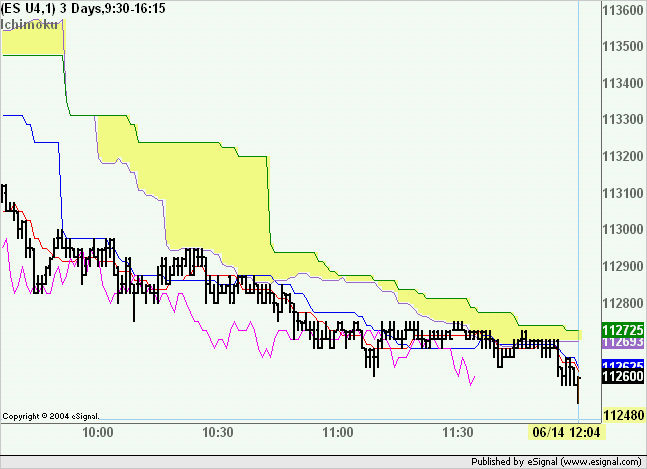
        Can someone please help with plotting ichimoku cloud cover into the future (right with no price yet).


        thanks,
        Dan

        Comment


        • #5
          The clouded area = between Leading Spans 1 and 2,

          We need help on adding a shaded area (known as a cloud) that is formed between Leading Spans 1 and 2, this defines support or resistance. Clouds also help to identify trend direction. When prices are above the cloud, the trend is up. vice versa.
          Many thanks

          Comment


          • #6
            the buy & sell signals

            Please could you add to your previouse work (which is very much appreciated) an alarm and/or grafic signal to indicate that a buy or a sell has been generated.

            Buy signal = Tenkan Sen crosses the Kijun Sen from bellow

            Sell signal = tenkan Sen crosses teh Kijun Sen from above

            Many Thanks
            Frank

            Comment


            • #7
              Frank
              If by Span1 and Span2 you mean SenkouA and SenkouB then the attached efs adds a shaded area between those two lines.
              Alex

              Attached Files

              Comment


              • #8
                Frank
                The attached efs adds a sound alert to the Ichimoku study.
                The alert will sound only at the close of a bar once the cross between the Tenkan and Kijun lines is confirmed
                Alex
                Attached Files

                Comment


                • #9
                  Thanks

                  Thanks Alexis

                  for prompt reply, and both sound alert on cross over plus shaded area.

                  Regards

                  Frank

                  Comment


                  • #10
                    The Chikou Span = Lagging Span why is it there?

                    Does anyone know what's the use of the Chikou Span = Lagging Span = Today's closing price plotted 26 periods behind


                    Am rather baffled why is it there as it is not in any of the variables used in the calculation?

                    Comment


                    • #11
                      Hi FKY,

                      The fourth line of the Ichimoku chart is constructed by adding the 52-day high and low and dividing by 2....(26). This number is then plotted 26 days ahead of the last completed trading day. As the third line is created by projecting it 26 days ahead, the fifth line (Chikou Span) is the inverse and projected back 26 days. It falls back to utilizing the last 52 days of data. The chart is based on 52 days and it uses the number 26 to determine historical cloud thickness as well as future projections in relation to price data and the likelihood of a retracement from the cloud or a push beyond it. Hope this helps.

                      Comment


                      • #12
                        how to plot cloud cover into the future

                        Hi DuaneG and Alexis C Montenegro,

                        thanks for the work and explanation, which brings up a few questions regarding the construction of this chart.

                        firstly why does your efs not plot the cloud into the future ? In an earlier post from Dan 03-20-2004 " he asked;-
                        "Can someone please help with plotting ichimoku cloud cover into the future (right with no price yet)."

                        could we have some help here or is there a limitation on what EFS can do into the future ?. This is very important it helps determine false break outs, apart from market timing, future support & resistence.


                        then secondly

                        This charting technique was not based on intraday prices but on daily and historical prices, so my question is what happens when we choose to use an intraday timescale like 15 minutes for our chart, do the calculations in the formula shift from a daily time frame to an intraday 15 minute time frame?


                        Finally as securities are not traded on Saturdays and that some markets trade nearly 24hrs a day maybe the time spans of 9, 26 and 52 should be modified to represent each instrument better.

                        What are your suggestions for optimized values for the time spans taking into account that futures are short lived and that currencies trade 24hrs a day?

                        Many Thanks

                        Frank

                        Comment


                        • #13
                          Frank
                          An efs cannot plot returned data points where there are no bars.
                          Having said that it is possible to draw those lines individually point by point using the draw functions in efs (see this thread for an example) however the extent of the coding required is beyond what I am available to do.
                          If this is important to you then I would suggest that you follow the guidelines provided in this post and contact one of the EFS Development Partners.
                          With regards to your second question the efs will calculate the Ichimoku study based on the data that is plotted in the chart.
                          Alex

                          Comment


                          • #14
                            Ichimoku

                            is there a way to change the color of the Tenkan Sen(conversion line) to white when it is downward sloping?

                            Also, I changed some of the colors of some of the indicators; however, I keep getting a syntax error message for line 26: would you mind looking it over to see if you can tell where my error is? (I had tried changing the color to 'dark blue' but got that syntax error message, and changed color to 'blue' but am still getting syntax error about 'dark blue'.

                            /********************************
                            Alexis C. Montenegro © June 2003
                            *********************************/

                            var vDonchian = new DonchianStudy(9, 0);
                            var vDonchian_2 = new DonchianStudy(26, 0);
                            var vDonchian_3 = new DonchianStudy(9, 26);
                            var vDonchian_4 = new DonchianStudy(26, 26);
                            var vDonchian_5 = new DonchianStudy(52, 26);
                            var vCntr = 0;

                            function preMain() {

                            setPriceStudy(true);
                            setStudyTitle("Ichimoku");
                            setCursorLabelName("Tenkan (conversion line) ", 0);
                            setCursorLabelName("Kijun (base line)", 1);
                            setCursorLabelName("Chikou (lagging span)", 2);
                            setCursorLabelName("SenkouA", 3);
                            setCursorLabelName("SenkouB", 4);
                            setDefaultBarStyle(PS_SOLID, 0);
                            setDefaultBarStyle(PS_SOLID, 1);
                            setDefaultBarStyle(PS_SOLID, 2);
                            setDefaultBarStyle(PS_SOLID, 3);
                            setDefaultBarStyle(PS_SOLID, 4);
                            setDefaultBarFgColor(Color.darkblue, 0);
                            setDefaultBarFgColor(Color.red, 1);
                            setDefaultBarFgColor(Color.yellow, 2);
                            setDefaultBarFgColor(Color.green, 3);
                            setDefaultBarFgColor(Color.magenta, 4);
                            setDefaultBarThickness(3, 0);
                            setDefaultBarThickness(3, 1);
                            setDefaultBarThickness(1, 2);
                            setDefaultBarThickness(1, 3);
                            setDefaultBarThickness(1, 4);
                            setPlotType(PLOTTYPE_LINE, 0);
                            setPlotType(PLOTTYPE_LINE, 1);
                            setPlotType(PLOTTYPE_LINE, 2);
                            setPlotType(PLOTTYPE_LINE, 3);
                            setPlotType(PLOTTYPE_LINE, 4);
                            checkVersion(3,"http://share.esignal.com/ContentRoot/ACM%20Test/Formulas/Ichimoku.efs"); //Comment this line out if modifying the code
                            }

                            function main() {

                            if(getBarState()==BARSTATE_NEWBAR){
                            vCntr +=1;
                            }
                            if(vCntr<53)
                            return;

                            var SenkouA = (vDonchian_3.getValue(DonchianStudy.BASIS)+vDonchi an_4.getValue(DonchianStudy.BASIS))/2;

                            if(SenkouA>vDonchian_5.getValue(DonchianStudy.BASI S))
                            setBarBgColor(Color.grey,0,vDonchian_5.getValue(Do nchianStudy.BASIS),SenkouA);
                            if(SenkouA<vDonchian_5.getValue(DonchianStudy.BASI S))
                            setBarBgColor(Color.grey,0,SenkouA,vDonchian_5.get Value(DonchianStudy.BASIS));

                            if(getBarState()==BARSTATE_NEWBAR){
                            if(vDonchian.getValue(DonchianStudy.BASIS,-2)<=vDonchian_2.getValue(DonchianStudy.BASIS,-2)&&
                            vDonchian.getValue(DonchianStudy.BASIS,-1)>vDonchian_2.getValue(DonchianStudy.BASIS,-1)){
                            Alert.playSound("ding.wav");
                            }
                            if(vDonchian.getValue(DonchianStudy.BASIS,-2)>=vDonchian_2.getValue(DonchianStudy.BASIS,-2)&&
                            vDonchian.getValue(DonchianStudy.BASIS,-1)<vDonchian_2.getValue(DonchianStudy.BASIS,-1)){
                            Alert.playSound("ding.wav");
                            }
                            }


                            if(getBarState() == BARSTATE_NEWBAR){
                            var nNum = 1;
                            }else{
                            var nNum = 0;
                            }

                            if(getBuildNumber()>636){
                            setBar(Bar.Value,-26+nNum,2,close(0));
                            }else{
                            setBar(Bar.Value,-26+nNum,new Array(null,null,close(0),null,null));
                            }

                            return new Array(vDonchian.getValue(DonchianStudy.BASIS),vDon chian_2.getValue(DonchianStudy.BASIS),
                            null,SenkouA,vDonchian_5.getValue(DonchianStudy.BA SIS));
                            }

                            Comment


                            • #15
                              Hello TraderJen,

                              "Color.darkblue" is not one of the color constants. You can use one from the list below or setup a custom color using Color.RGB(#, #, #). The RGB numbers range from 0-255.

                              Jason K.
                              Project Manager
                              eSignal - an Interactive Data company

                              EFS KnowledgeBase
                              JavaScript for EFS Video Series
                              EFS Beginner Tutorial Series
                              EFS Glossary
                              Custom EFS Development Policy

                              New User Orientation

                              Comment

                              Working...
                              X