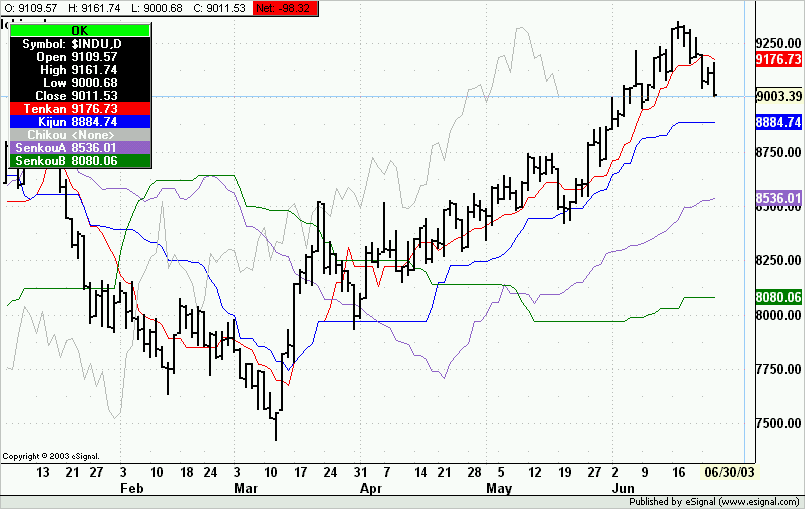
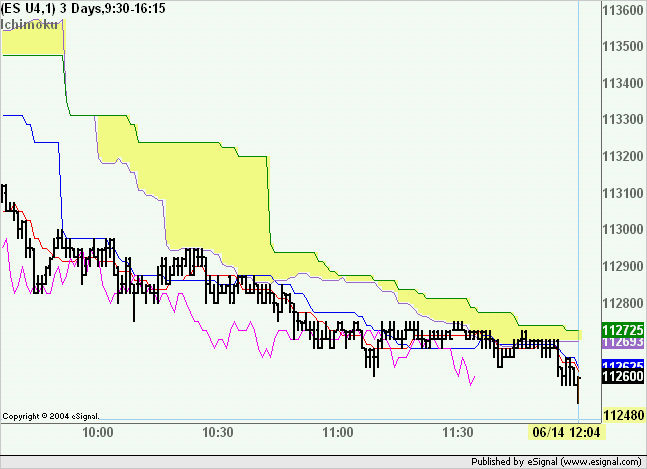
I was wondering if it were possible to write these five lines so they can plot on an Advanced Chart...
(this is from a website)
Calculation
The Ichimoku chart consists of five lines and the calculation of these five lines involves only taking the midpoints of previous highs and lows, similar to the Moving Average studies. Even with its simplicity, the completed chart is able to present a clear perspective into the price action of the security at hand.
The five lines are calculated as follows:
1) Tenkan-Sen = Conversion Line = (Highest High + Lowest Low) / 2, for the past 9 periods
2) Kijun-Sen = Base Line = (Highest High + Lowest Low) / 2, for the past 26 periods
3) Chikou Span = Lagging Span = Today's closing price plotted 26 periods behind
4) Senkou Span A = Leading Span A = (Tenkan-Sen + Kijun-Sen) / 2, plotted 26 periods ahead
5) Senkou Span B = Leading Span B = (Highest High + Lowest Low) / 2, for the past 52 periods, plotted 26 periods ahead


Comment