Bare with my poor english skills. Here is my idea and should'nt be to hard , I am just not good at creating EFS's only editing them.I previously was wanting esignal to input a waist on top of candlesticks. But, at this time that is not possible, so I came up with a better idea. He is the theory:
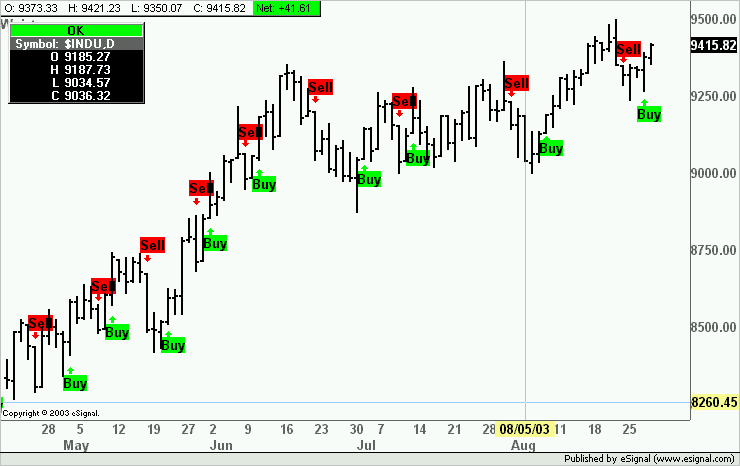
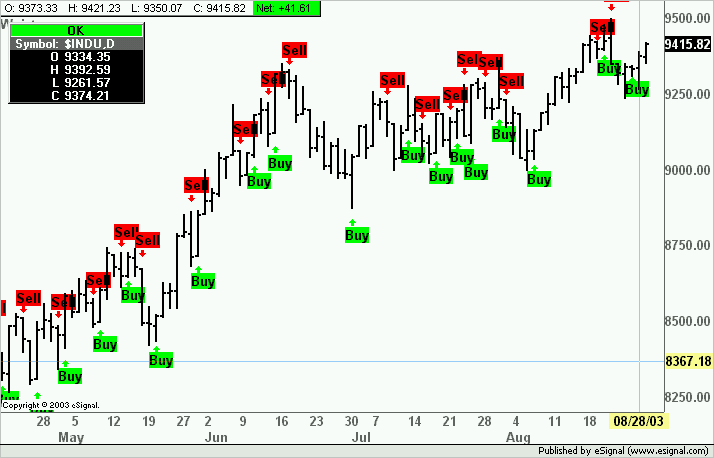
I have a buysell.efs shown in the picture below, with the buy/sell signals. This efs triggers are plotted based on a moving average.
What I would like to have is this:
1. A buy signal based on the candle stick waist, when the current candlestick closes with the WAIST ABOVE the previous candlestick a buy signal would be generated.
2. A sell signal would follow the exact opposite of the above. When the current candlestick closes with the waist below the previous candlestick a sell signal would be generated.
Note: the code would have to include an ignore function for repeats of paragraph #1 until paragraph #2 came into play.
I have include the buysell.efs and the code for creating a candlestick waist in this post. The candlesticks waste shows up on charts as little lines (barely seen) on the side of candlesticks. I would recommend that the waist need not be seen in this new efs. (distracting!)
Candlestick waist is plotted based on: (open()+close())/2;
I beleive this would be a great tool for those who rely on candlestick charting and also the Murrey Math theory.
I could not upload more than one file and I have 3 to make it easier for coding this idea. So i will post 2 more message with thso files. Sorry I know no other way!
Thanks,
Realm


Comment