Hello All,
First time posting on this site....
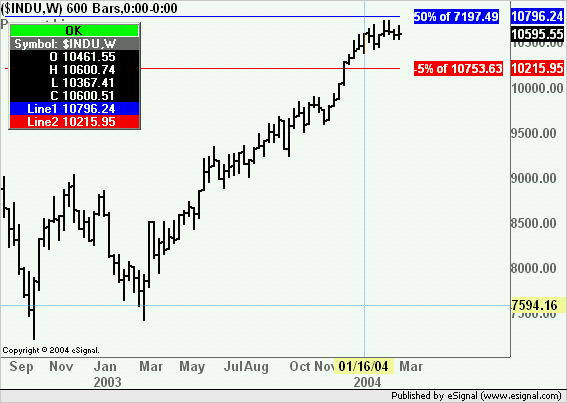
Basically, I want to create a formula whereby I can add or deduct a percentage from a price bar on a chart.
So, e.g. take a daily chart of the $INDU over the last year. I would like to then add on a value of 50% from the March low of 2003. I would like this to be indicated by perhaps a line across the chart at where the 50% point is.
Also, I would like to be able to subtract a value from e.g. a high from the last 2 weeks, and would like the formula to be able to put in a line wherever the value of the percentage I deduct is. It would not matter if the Addition and Subtraction formula are different.
Any help would be much appreciated. These studies would be to be able to Gann analysis on the charts.
Many many thanks in advance.
DSMODI

Comment