Announcement

Collapse
No announcement yet.

Adding Percentages

Collapse
X
 
  • Filter
  • Time
  • Show
Clear All
new posts

  • Adding Percentages

    Hello All,

    First time posting on this site....

    Basically, I want to create a formula whereby I can add or deduct a percentage from a price bar on a chart.

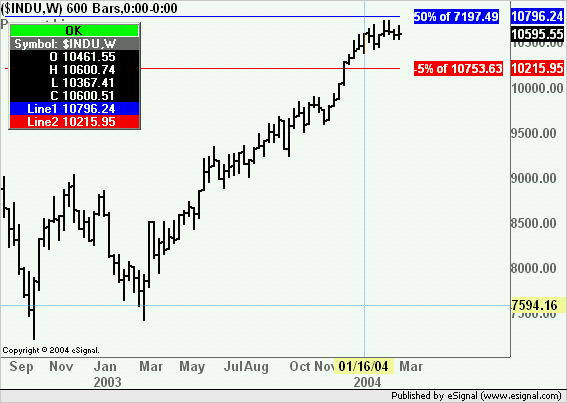
    So, e.g. take a daily chart of the $INDU over the last year. I would like to then add on a value of 50% from the March low of 2003. I would like this to be indicated by perhaps a line across the chart at where the 50% point is.
    Also, I would like to be able to subtract a value from e.g. a high from the last 2 weeks, and would like the formula to be able to put in a line wherever the value of the percentage I deduct is. It would not matter if the Addition and Subtraction formula are different.
    Any help would be much appreciated. These studies would be to be able to Gann analysis on the charts.

    Many many thanks in advance.

    DSMODI
  • #2
    DSMODI
    The attached efs will compute and plot two lines based on user defined values and percentages.
    Load the efs then in Edit Studies insert the values that need to be used for the calculations, the percentages (positive or negative) and select the color for the lines.
    As is the efs is set for two user inputs only each one resulting in one returned plot but you can edit the script to add as many inputs or returned plots as you wish.
    Hope this helps
    Alex

    Attached Files

    Comment


    • #3
      ALEXIS
      This is really good. Thank you very much for doing it.
      However, I was wondering if it was possible for the program to automatically read the price bar of wherever the cursor (or cross-hair) is, and add (or subtract) the percentage from the low of the bar?
      Once again, many thanks.

      Comment


      • #4
        Hi,

        So are you after a single bar that would then pick the low and draw +Percent and -Percent from the low? Or are you looking for a way to select on bar and have that draw +5 Percent from the high of than bar, and then select another bar and it draws -5% from that bar?

        Garth
        Garth

        Comment


        • #5
          GSPIKER

          Hi, Ideally I would like it to pick a bar using the cursor, and then be able to ADD a percentage to the LOW or SUBTRACT a percentage from the HI. I don't mind if there are different EFS for the percentages, but would like the HI/LO bar selected automatically. The addition percentages would be taken from the LO automatically, and the subtraction automatically from the HI of the chosen bar.

          Additionally, it would be great if the line that gets drawn can begin from above the selected bar and stretch to the right.

          Many thanks in anticipation....

          Comment


          • #6
            Hi,

            This shouldn't be too hard to do, if I understand your needs correctly. It may take until the weekend before I can look at it seriously however.

            G
            Garth

            Comment


            • #7
              GSPIKER
              Hi,

              Many thanks for your kind offer to do this for me - I really do appreciate all assistance given by yourself and Alexis.

              To clarify my requirement, I would like to Add a percentage (in my case it will typically be Gann percentages) to a bar. If I am adding, then it should take it from the low of the bar, and if subtracting, then from the high of the bar.(although I may be using candlestick charts - please let me know if that makes a difference n which case I don't mind using just the bar chart).
              Ideally, I would like the line to be drawn from vertically above where the percentage is calculated from.

              Please do let me know if I should give any more information.

              Many thanks and regards.

              Comment


              • #8
                Hi,

                Before I work on this, have you looked at the Sq of 9 tool provided by Chris Kryza? It is VERY nice.

                It can be found in the Specialty Scripts group.

                Garth
                Garth

                Comment


                • #9
                  GSPIKER

                  Hi,

                  Thanks for pointing that out to me - it'll certainly be useful. However, the type of stuff I want is different as they are percentages relative to the actual price bar, as opposed to retracements between 2 points.

                  If possible, please have a look at my earlier request.

                  With many thanks...

                  Comment


                  • #10
                    OK, great! Just didn't want to duplicate effort. This should be simple to do, and once I dig up 30 minutes or so (sometime this weekend) I will code it up.

                    G
                    Garth

                    Comment


                    • #11
                      OK,

                      I think this is what you are looking for. I added some info in the comments, but basically you just double left click near the high of a bar to get the high line drawn, and near the low of a bar to get the low bar drawn.

                      Seems to work OK with the limited testing I did.

                      You can change the % to add/subtract using edit studies (this is the same as what Alex did).

                      Let me know if this isn't what you wanted/needed.

                      Garth
                      Attached Files
                      Garth

                      Comment


                      • #12
                        GSPIKER

                        Thank you very very much for the effort you put into putting together this formula for me. Very kind of you indeed.

                        Just for your information Using your code, I made some ammendments and put together the efs attached, which does more or less of what I wanted.

                        I was, however, wondering if there was a way of labelling the lines drawn,on the far left of the line drawn with the percentage for that line. I notice there is a labelling facility in the AddLineTool system function, but this does not seem to do it.

                        Of course, any assistance would once again be appreciated, but otherwise the way things are is fine..

                        Once again, many thanks mate....

                        Comment


                        • #13
                          Hi,

                          FYI, iIt doesn't look like the code attached to the post. I would be curious to see what you changed.

                          The label function with the AddLineTool() functions is for the eSignal engine...it has nothing to do with a label that shows up on a chart.

                          Look at drawTextRelative() for a method of drawing text on the screen.

                          If you need help adding it to the code, just let me know how you wish the lines labeled and I can add it (after you post up your mods).

                          Garth
                          Garth

                          Comment


                          • #14
                            yikes - that was a quick reply - and apologies for oversight of not adding the code ...

                            here it is ...

                            the changes I've made is all simple stuff...

                            in the meantime - i'll have a look at the function you mention as well....

                            many thanks
                            Attached Files

                            Comment


                            • #15
                              here's an updated version of the one below .... maybe this is the way to put the percentage text in, though please do cocme back with any other suggestions you may have....

                              Cheers
                              Attached Files

                              Comment

                              Working...
                              X