Announcement

Collapse
No announcement yet.

% Off Average Volume

Collapse
X
 
  • Filter
  • Time
  • Show
Clear All
new posts

  • % Off Average Volume

    Hello,

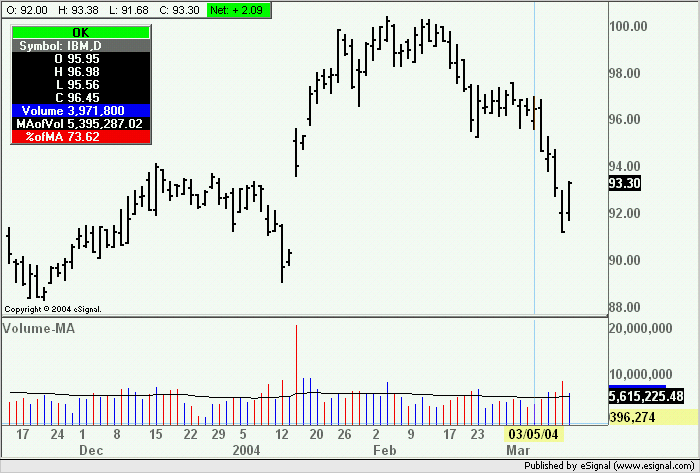
    Im using the 50 Day Ema Volume script I got from Alexis. I would like to know if it would be possible to plot a percentage to show how hi/low the volume is from its 50 day moving average.

    Or maybe esignal can incorporate it in the quote window in the next version.

    Thanks,
    Brian

  • #2
    Brian
    The attached efs should do what you asked.
    It plots the 50 day EMA of Volume and computes what percentage Volume is of the MA. If Volume is below 100% it colors the value in the Cursor Window in red, if above 100 it colors it in blue.
    Length of the MA and type can be modified through Edit Studies. Also selectable in Edit Studies is how the Volume bars are colored (ie based on Close or Volume).
    Alex

    Attached Files

    Comment


    • #3
      Thanks again Alexis this is what I was looking for.

      Comment


      • #4
        Alexis

        I fell in love with the first emaofvolCloses script you made for me posted below. Can you please place the %offAvgVolume code in it. I tried to do it but it looks to complicated. I can only change colors and make the bars\lines thicker.


        //{{EFSWizard_Description
        //
        // This formula was generated by the Alert Wizard
        //
        //}}EFSWizard_Description 7532


        //{{EFSWizard_Declarations

        var vEMA50_of_Volume = new MAStudy(50, 0, "Volume", MAStudy.EXPONENTIAL);
        var vLastAlert = -1;

        //}}EFSWizard_Declarations 12357


        function preMain() {
        /**
        * This function is called only once, before any of the bars are loaded.
        * Place any study or EFS configuration commands here.
        */
        //{{EFSWizard_PreMain
        setPriceStudy(false);
        setStudyTitle("EMAofVol");
        setCursorLabelName("Vvol", 0);
        setCursorLabelName("EMAofVol", 1);
        setDefaultBarStyle(PS_SOLID, 0);
        setDefaultBarStyle(PS_SOLID, 1);
        setDefaultBarFgColor(Color.black, 0);
        setDefaultBarFgColor(Color.black, 1);
        setDefaultBarThickness(4, 0);
        setDefaultBarThickness(2, 1);
        setPlotType(PLOTTYPE_HISTOGRAM, 0);
        setPlotType(PLOTTYPE_LINE, 1);
        //}}EFSWizard_PreMain 49492

        }

        function main() {
        /**
        * The main() function is called once per bar on all previous bars, once per
        * each incoming completed bar, and if you don't have 'setComputeOnClose(true)'
        * in your preMain(), it is also called on every tick.
        */

        //{{EFSWizard_Expressions
        //{{EFSWizard_Expression_1
        if (
        close() > close(-1)
        ) onAction1()
        //}}EFSWizard_Expression_1 6718

        //{{EFSWizard_Expression_2
        else if (
        close() < close(-1)
        ) onAction2()
        //}}EFSWizard_Expression_2 8711

        //{{EFSWizard_Expression_3
        else if (
        close() == close(-1)
        ) onAction3();
        //}}EFSWizard_Expression_3 8217

        //}}EFSWizard_Expressions 52868


        //{{EFSWizard_Return
        return new Array(
        volume(),
        vEMA50_of_Volume.getValue(MAStudy.MA)
        );
        //}}EFSWizard_Return 11888

        }

        function postMain() {
        /**
        * The postMain() function is called only once, when the EFS is no longer used for
        * the current symbol (ie, symbol change, chart closing, or application shutdown).
        */
        }

        //{{EFSWizard_Actions
        //{{EFSWizard_Action_1
        function onAction1() {
        setBarFgColor(Color.RGB(0,0,255), 0);
        vLastAlert = 1;
        }
        //}}EFSWizard_Action_1 9883

        //{{EFSWizard_Action_2
        function onAction2() {
        setBarFgColor(Color.RGB(255,0,0), 0);
        vLastAlert = 2;
        }
        //}}EFSWizard_Action_2 10496

        //{{EFSWizard_Action_3
        function onAction3() {
        setBarFgColor(Color.RGB(134,133,135), 0);
        vLastAlert = 3;
        }
        //}}EFSWizard_Action_3 11807

        //}}EFSWizard_Actions 60381

        Comment


        • #5
          Brian
          Unfortunately the added logic cannot be created using the Formula Wizard and even if I just add it to the script generated by the Wizard you will no longer be able to open the efs using the Wizard.
          What I can do is faithfully replicate the output of the efs you posted and add the percentage code to it.
          I will also comment the script so as to make it easier to identify the components
          Alex

          Comment


          • #6
            I think I figured it out Alexis I'm going to try it now

            if(Source=="Price"){
            if (close() > close())
            setBarFgColor(Color.RGB(255,0,0));
            else if (close() < close())
            setBarFgColor(Color.RGB(0,0,255));
            else if (close() == close())
            setBarFgColor(Color.RGB(128,128,128));

            Comment


            • #7
              Nope I cant get the bars to color properly like the one posted below. I need your help agian.

              Comment


              • #8
                Alexis,

                I did it I forgot to put in (-1) to look back one bar. Now it seems to work like the one posted below. I hope I did everything right I changed the way it colors the volume bars follwing price closes.


                if(Source=="Price"){
                if (close() > close(-1))
                setBarFgColor(Color.RGB(0,0,255));
                else if (close() < close(-1))
                setBarFgColor(Color.RGB(255,0,0));
                else if (close() == close(-1))
                setBarFgColor(Color.RGB(128,128,128));
                }
                Last edited by Co|dStee|; 03-12-2004, 05:15 PM.

                Comment


                • #9
                  Brian
                  Looks perfect to me.
                  Have a great weekend
                  Alex

                  Comment


                  • #10
                    Hi Alex,

                    You assisted with the compilation of the efs below. I tried to copy and paste the efs but I couldn't get it to work. I inserted the additional piece of code cold steel suggested but I keep on getting the following error message "line 66: Source is not defined". I wonder if you can help me?

                    Cheers

                    Carlton
                    Attached Files

                    Comment


                    • #11
                      Carlton
                      Not sure what you are trying to accomplish.
                      If all you want to do is plot Volume and its moving average and have the Volume bars painted based on price or prior volume then click here and download VolumeMA.efs.
                      If instead you want to compute what percentage Volume is of its moving average then look at my efs earlier in this same thread
                      Alex

                      Comment


                      • #12
                        Alex,

                        Can you therefore tell me what "cold steel" was trying to achieve when he requested "please place the %offAvgVolume code in it"?

                        Cheers

                        Carlton

                        Comment


                        • #13
                          Carlton
                          AFAIK he was trying to replicate with the Formula Wizard the efs I posted in reply to his first message
                          Alex

                          Comment


                          • #14
                            Alex,

                            OK, mate. Thats great.

                            Cheers

                            Carlton

                            Comment

                            Working...
                            X