Hello,
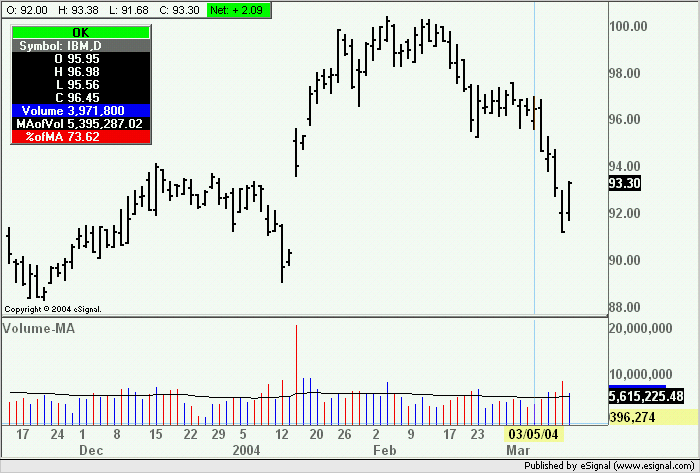
Im using the 50 Day Ema Volume script I got from Alexis. I would like to know if it would be possible to plot a percentage to show how hi/low the volume is from its 50 day moving average.
Or maybe esignal can incorporate it in the quote window in the next version.
Thanks,
Brian
Im using the 50 Day Ema Volume script I got from Alexis. I would like to know if it would be possible to plot a percentage to show how hi/low the volume is from its 50 day moving average.
Or maybe esignal can incorporate it in the quote window in the next version.
Thanks,
Brian

Comment