Announcement

Collapse
No announcement yet.

30 minute OR (opening range)

Collapse
X
 
  • Filter
  • Time
  • Show
Clear All
new posts

  • 30 minute OR (opening range)

    Hey,

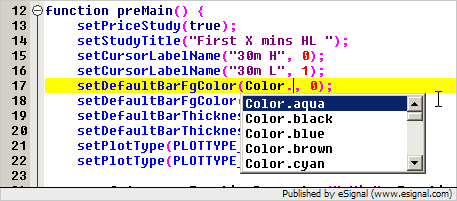
    I know someone has to have made an EFS for the 30 minute Opening Range that I can input into eSignal. Can someone direct me to the file(s)? Also possible 1 minute OR.

    Similar to what TS has. Thanks.

  • #2
    hrmm,

    I downloaded that, it was designed for 60 minute. I just searched the document for "60" and every 60 i saw i changed to "30" do you think it is accurate now with 30min OR?

    Code:
    /*****************************************************************
    Provided By : eSignal. (c) Copyright 2003
    *****************************************************************/
    
    function preMain() {
        setPriceStudy(true);
        setShowCursorLabel(false);
    }
    
    var vStartTime = null;
    var v30minHigh = null;
    var v30minLow = null;
    var v30minClose = null;
    var FirstBar = null;
    
    function main() {
        if (getDay() != getDay(-1)) {
            vStartTime = getValue("Time");
            FirstBar = getFirstBarIndexOfDay(vStartTime);
            v30minHigh = high();
            v30minLow = low();
            v30minClose = close();
        }
        var vTime = getValue("Time");
    
        //debugPrintln(getCurrentBarIndex() + "  " + (vTime - vStartTime)/3600000);
        // (vTime - vStartTime) = milliseconds / 3600000 = hours
        if ((vTime - vStartTime)/3600000 < 1.0) {    // still in first hour of the day
            v30minHigh = Math.max(high(), v30minHigh);
            v30minLow = Math.min(low(), v30minLow);
            v30minClose = close();
        }
    
        if (FirstBar != null) {
            drawLineRelative( FirstBar, v30minHigh, 0, v30minHigh, PS_DASH, 1, Color.green, 0) // First bar high
            drawTextRelative( 2, v30minHigh, v30minHigh.toFixed(4), Color.green, null, Text.VCENTER|Text.BOLD, null, 10, 0.5);
            drawLineRelative( FirstBar, v30minClose, 0, v30minClose, PS_DASH, 1, Color.lime, 1) // First bar low
            drawTextAbsolute( 2, v30minClose, v30minClose.toFixed(4), Color.lime, null, Text.VCENTER|Text.BOLD, null, 10, 1.5);
            drawLineRelative( FirstBar, v30minLow, 0, v30minLow, PS_DASH, 1, Color.green, 2) // First bar close
            drawTextAbsolute( 2, v30minLow, v30minLow.toFixed(4), Color.green, null, Text.VCENTER|Text.BOLD, null, 10, 2.5);
        }
        
        return;
    }

    Comment


    • #3
      Opening Range + Opening

      Hi:
      Can the Opening # be added?
      So, the efs would have 30 minute h/l & Opening Price.

      Thanks,

      Harndog

      Comment


      • #4
        Hello Kujax and Harndog,

        Here's a formula that will give you the first X minutes high and low,
        FirstXminsHL.efs. Let me know if this works for you.
        Jason K.
        Project Manager
        eSignal - an Interactive Data company

        EFS KnowledgeBase
        JavaScript for EFS Video Series
        EFS Beginner Tutorial Series
        EFS Glossary
        Custom EFS Development Policy

        New User Orientation

        Comment


        • #5
          Originally posted by JasonK
          Hello Kujax and Harndog,

          Here's a formula that will give you the first X minutes high and low,
          FirstXminsHL.efs. Let me know if this works for you.
          JasonK - When you say "X" minutes, do we have to go into the EFS and edit it to our liking? Or what exactly do you mean? For example, myself (and i think Harndog) both just want 30 minute OR.

          Comment


          • #6
            Correct, go into edit studies and enter 30 for Number of Minutes. If you want to change the default, change the number on line 27 to your liking. Currently it's set to 60 minutes.
            Jason K.
            Project Manager
            eSignal - an Interactive Data company

            EFS KnowledgeBase
            JavaScript for EFS Video Series
            EFS Beginner Tutorial Series
            EFS Glossary
            Custom EFS Development Policy

            New User Orientation

            Comment


            • #7
              Awesome JasonK

              So this plots the High and the Low from first X minutes. Cool!

              Comment


              • #8
                is there anyway to make the HIGH blue and the LOW red line?

                Comment


                • #9
                  Hello KuJax,

                  Yep, open the formula in the EFS editor and change the color on lines 17 and 18. Delete the ".blue" and then when you type the "." again, you will get a list of the available color choices. The 0 and 1 correspond to the high and low, respectively.

                  Jason K.
                  Project Manager
                  eSignal - an Interactive Data company

                  EFS KnowledgeBase
                  JavaScript for EFS Video Series
                  EFS Beginner Tutorial Series
                  EFS Glossary
                  Custom EFS Development Policy

                  New User Orientation

                  Comment


                  • #10
                    Originally posted by JasonK
                    Hello KuJax,

                    Yep, open the formula in the EFS editor and change the color on lines 17 and 18. Delete the ".blue" and then when you type the "." again, you will get a list of the available color choices. The 0 and 1 correspond to the high and low, respectively.

                    didnt seem to help.

                    on Line 36 it states

                    "fp3.setDefault(Color.blue);"

                    when i change that to .red it changes both lines to red. back to blue, both lines blue, even after changing line 17 and/or 18

                    Comment


                    • #11
                      Hello KuJax,

                      My bad. I completely overlooked the FunctionParameter stuff. I've modified the formula to color the high blue and low red by default. You can also change the colors through edit studies. If you want to change the default colors, you'll now change them on lines 36 and 40 instead. No need to change 17 or 18 now either because of the way we're using the FunctionParameter class. In fact lines 17 and 18 could be removed.

                      FirstXminsHL.efs
                      Jason K.
                      Project Manager
                      eSignal - an Interactive Data company

                      EFS KnowledgeBase
                      JavaScript for EFS Video Series
                      EFS Beginner Tutorial Series
                      EFS Glossary
                      Custom EFS Development Policy

                      New User Orientation

                      Comment


                      • #12
                        A couple of questions for customisation

                        Hi,

                        The last update on this topic is a few years ago, so not sure who will reply if anyone.

                        I'm new to EFS and these forums but will hopefully find the time to go through the tutorials soon. I do have some basic understanding of how a program hangs together and it's great to find a piece of code which meets most of your requirements and be able to modify it and through trial and error try to meet the rest, so thankyou for that.

                        I have a couple of questions because at this moment I do not understand the EFS calls and syntax. I can see how to change the number of minutes to display the results for, change the decimal points for the resulting values, line thickness and line type etc. so that's a start.

                        1. Contained within the EFS are 2 calculated variables vHigh and vLow for the high and low of the opening range of interest. What I wanted to actually display was an offset from those variables e.g. +/- 2.00 for the ES E-mini contract. I tried adding an additional line to the EFS to recalculate the value before output e.g. vLow = vLow+2.00 but the results not only are inaccurate in terms of value, they also seem to be at different offsets above and below the opening range.

                        What would be the syntax of such a command and how is it affacted by the tick size e.g. 0.25 for the ES contract?

                        2. If I was interested in plotting a line on the chart as a multiplier of the opening range size, rather than a set size of offset what would the syntax look like for that?

                        e.g. take the correctly calculated value vHigh as it stands from the original EFS and perform the following logic:

                        vHigh = vHigh + ((vHigh-vLow)*3.0)

                        If I wanted to retain vHigh as well, I believe I would have to define a new variable called vHighx3 and cut and paste the lines in the EFS which do that and hopefully by trial and error could get that working.

                        3. When the values are plotted at the end of the line, they are unfortunately displayed at exactly the same vertical position as another EFS I use. I tried most of the combinations available but don't seem to be able to find a suitable location for the values so they are visible.

                        Is the field of positioning available quite limited?

                        4. When a 1 minute bar chart is selected and the EFS is modified to plot the 1 minute opening range it works fine. However, when the interval of the bar chart is changed to say 5 minutes, the horizontal lines are plotted from the high and low of the first bar, in this case 5 minutes and the values change to match from 1 to 5 minutes.

                        I'm guessing it's not possible to retain the horizontal lines and values for the 1 minute opening range even when the chart is displayed with a larger time frame because of the granularity of the data. In which case it might be nice for the EFS to recognise this and drop the displayed information as it is now inaccurate in terms of text in the cursor window etc.

                        5. Using the parts of the EFS which perform simple plotting of lines and values is it possible to:

                        - Add text as well as a value in close proximity of the line or is it value only or perhaps text ony but not both?

                        - I can try to program other levels I am interested in which require more calculation but with limited knowledge that will be time consuming. Is it therefore possible to do all the calculations externally e.g. in Excel, which I am much more familar with, produce an output file and then read in the resulting values, line thickness, colour, text etc. to be plotted?

                        It would be nice to get some of the "detached" information from Excel onto the chart so it is much more "in your face" and less easy to miss!

                        Many thanks for any useful suggestions.

                        Steve
                        Last edited by sajones; 06-11-2007, 04:23 AM.

                        Comment


                        • #13
                          -

                          Hello Steve,

                          Originally posted by sajones
                          Hi,

                          The last update on this topic is a few years ago, so not sure who will reply if anyone.

                          I'm new to EFS and these forums but will hopefully find the time to go through the tutorials soon. I do have some basic understanding of how a program hangs together and it's great to find a piece of code which meets most of your requirements and be able to modify it and through trial and error try to meet the rest, so thankyou for that.

                          I have a couple of questions because at this moment I do not understand the EFS calls and syntax. I can see how to change the number of minutes to display the results for, change the decimal points for the resulting values, line thickness and line type etc. so that's a start.
                          Going through the tutorials will help give you a better understanding of the EFS basics. If you need a better understanding of JavaScript, which is the basis for EFS, please visit the JavaScript for EFS video series. You can find a link to that and our other EFS documentation below my signature.

                          1. Contained within the EFS are 2 calculated variables vHigh and vLow for the high and low of the opening range of interest. What I wanted to actually display was an offset from those variables e.g. +/- 2.00 for the ES E-mini contract. I tried adding an additional line to the EFS to recalculate the value before output e.g. vLow = vLow+2.00 but the results not only are inaccurate in terms of value, they also seem to be at different offsets above and below the opening range.

                          What would be the syntax of such a command and how is it affacted by the tick size e.g. 0.25 for the ES contract?
                          vLow = vLow+2.00; would be the correct syntax. There may be something else going on in the code you are using. Post the formula you're working with and someone may be able to provide more specific guidance. The tick size of the symbol should not affect the output of the vLow result.

                          2. If I was interested in plotting a line on the chart as a multiplier of the opening range size, rather than a set size of offset what would the syntax look like for that?

                          e.g. take the correctly calculated value vHigh as it stands from the original EFS and perform the following logic:

                          vHigh = vHigh + ((vHigh-vLow)*3.0)
                          Again, the syntax you're showing here is valid. vHigh will be assigned a valid number as long as vHigh and vLow also have been assigned to valid numbers. If that is the case then all you should have to do to plot this result is return vHigh at the end of main() with the return statement.

                          function main() {

                          ...

                          return vHigh;
                          }

                          If I wanted to retain vHigh as well, I believe I would have to define a new variable called vHighx3 and cut and paste the lines in the EFS which do that and hopefully by trial and error could get that working.
                          You are correct. Try the following.

                          var vHighx3 = vHigh + ((vHigh-vLow)*3.0)

                          To plot both vHigh and vHighx3, return an array of variables from main()'s return statement.

                          return new Array(vHigh, vHighx3);


                          3. When the values are plotted at the end of the line, they are unfortunately displayed at exactly the same vertical position as another EFS I use. I tried most of the combinations available but don't seem to be able to find a suitable location for the values so they are visible.

                          Is the field of positioning available quite limited?
                          Positioning is determined by the order in which the formulas are applied and the order in which the plotted series are returned from main()'s return statement. The last ones applied or returned in the array will be on top. At this time, EFS does not have any functionality to control this display, which is also referred to a z-order control. Fee free to submit a request for such functionality to our development team at [email protected].

                          4. When a 1 minute bar chart is selected and the EFS is modified to plot the 1 minute opening range it works fine. However, when the interval of the bar chart is changed to say 5 minutes, the horizontal lines are plotted from the high and low of the first bar, in this case 5 minutes and the values change to match from 1 to 5 minutes.

                          I'm guessing it's not possible to retain the horizontal lines and values for the 1 minute opening range even when the chart is displayed with a larger time frame because of the granularity of the data. In which case it might be nice for the EFS to recognise this and drop the displayed information as it is now inaccurate in terms of text in the cursor window etc.
                          If the opening range of time used is the same for both the 1 minute and 5 minute chart, the high and low results should be the same. You may need to post some chart images to better illustrate the problem you're seeing. If you're using a custom formula you've created, you should post that as well.

                          5. Using the parts of the EFS which perform simple plotting of lines and values is it possible to:

                          - Add text as well as a value in close proximity of the line or is it value only or perhaps text ony but not both?
                          Yes you can draw text on the chart using the Drawing functions drawText() or drawTextRelative(). If you do not want the series to be plotted, don't return the series in the return statement.

                          - I can try to program other levels I am interested in which require more calculation but with limited knowledge that will be time consuming. Is it therefore possible to do all the calculations externally e.g. in Excel, which I am much more familar with, produce an output file and then read in the resulting values, line thickness, colour, text etc. to be plotted?

                          It would be nice to get some of the "detached" information from Excel onto the chart so it is much more "in your face" and less easy to miss!

                          Many thanks for any useful suggestions.

                          Steve
                          I think it would be more difficult and time consuming to export the data into excel and import the results in excel back to the chart. You would need to have excel export its results to text file(s) and then have an advanced routine in EFS that parses the data from the text file(s) using the File Object. I personally recommend that you learn how to code in EFS.
                          Jason K.
                          Project Manager
                          eSignal - an Interactive Data company

                          EFS KnowledgeBase
                          JavaScript for EFS Video Series
                          EFS Beginner Tutorial Series
                          EFS Glossary
                          Custom EFS Development Policy

                          New User Orientation

                          Comment


                          • #14
                            For Esignal Staff-

                            First thing....this thread is awesome. One question though.....how can I change the start time on the formula? Lets say I'm trading west coast and I want the first 15 min from 6:30am PST...how would I go about doing that?

                            Another question....how would I be able to duplicate the opening range above and below as pivots? I would say that I need it for up to 4 ranges above and below the opening range.


                            Thanks
                            Last edited by strader9999; 07-13-2010, 06:06 PM.

                            Comment

                            Working...
                            X