Announcement

Collapse
No announcement yet.

EFS lines breaking up

Collapse
X
 
  • Filter
  • Time
  • Show
Clear All
new posts

  • EFS lines breaking up

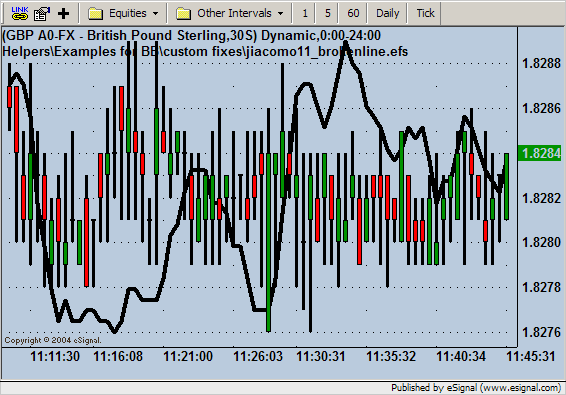
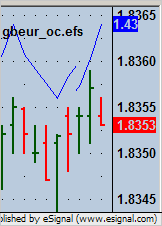
    The lines of the efs I've written break up when they reach upper or lower limits of the chart. If I run the cursor over the chart or if a new bar starts, then the line re-sizes and is OK for a moment. Is there a way to prevent my efs line(s) from breaking up?
    Thanks

  • #2
    Hello Jack,

    Please post your formula so I can test it on my end. Or post some images so I can get a better understanding of the problem.
    Jason K.
    Project Manager
    eSignal - an Interactive Data company

    EFS KnowledgeBase
    JavaScript for EFS Video Series
    EFS Beginner Tutorial Series
    EFS Glossary
    Custom EFS Development Policy

    New User Orientation

    Comment


    • #3
      Hi Jason, I've attached a jpg file below that shows the line while it's broken up. If I run the cursor over the chart or if a new bar starts, then the line re-sizes itself and is no longer broken. This happens when the line reaches the upper or lower area of the chart. It is very annoying as it happens continuously. I actually have several efs lines I've put up myself and I have to keep sweeping the screens with my cursor to keep them from breaking up.
      Thanks for looking into this, Jack
      P.S. I've just gone in to edit my reply and I added an efs file (below). It's basically an overlay on the British Pound (GBP A0-FX) so I can watch the relative strength VS the Euro, and it's a simple 4 period MA of the close.

      function main() {

      var t1Sum = 0.00;
      var t11Sum = 0.00;
      var c1Value;

      c1Value = getValue("close", -3, "GBPEUR A0-FX");
      t1Sum = c1Value;
      c1Value = getValue("close", -2, "GBPEUR A0-FX");
      t1Sum += c1Value;
      c1Value = getValue("close", -1, "GBPEUR A0-FX");
      t1Sum += c1Value;
      c1Value = getValue("close", 0, "GBPEUR A0-FX");
      t1Sum += c1Value;
      t11Sum += (t1Sum / 4);

      return (t11Sum);

      }
      Attached Files
      Last edited by giacomo11; 10-28-2004, 11:21 AM.

      Comment


      • #4
        Hello Jack,

        All I can say at this point is that it's not a problem with the code. At least I'm not experiencing the broken lines. Based on your comment that moving your cursor over the lines forces the screen to refresh the graphics means that the problem is most likely related to your system's video card or drivers. If you can, test your formula on another PC and see if you still experience this display issue. If not, than you might try updating the drivers for your video card, or possibly a newer video card. Just some ideas to consider.


        Jason K.
        Project Manager
        eSignal - an Interactive Data company

        EFS KnowledgeBase
        JavaScript for EFS Video Series
        EFS Beginner Tutorial Series
        EFS Glossary
        Custom EFS Development Policy

        New User Orientation

        Comment


        • #5
          Hi Jason, Thanks for the reply. It's odd because it happens on both my screens; one has an Intel card and the other has an NVidia card. Also, it only happens when the line extends toward the upper or lower limits of the chart, like at about 11:16 and 11:33 on your chart. In other words, it might have happened then but moving the cursor over the chart would fix it.
          Anyway, Thanks again for your help.
          Jack

          Comment


          • #6
            Hello Jack,

            I'll keep testing. It's possible I didn't give it enough time.

            Do you have auto-scaling on?
            What intervals are you using?
            Does the break occur while the chart window has focus?

            Any other details you can provide to help reproduce the problem would be helpful. Also, please post your complete formula as an attachment. I want to make sure I'm testing under the same variables.
            Jason K.
            Project Manager
            eSignal - an Interactive Data company

            EFS KnowledgeBase
            JavaScript for EFS Video Series
            EFS Beginner Tutorial Series
            EFS Glossary
            Custom EFS Development Policy

            New User Orientation

            Comment


            • #7
              Hi Jason, I have Auto Scale on and Scale Price Data Only is also on. I use 30s, 1 Min and 3 Min; it happens on all three time frames. If by "the chart window has focus" means that that one particular chart is highlighted or is the last one I clicked on, yes. I can put the cursor on the chart or click on the chart and it will refresh but the line soon breaks again, when it is in upper or lower ranges, even if I leave the cursor right on it and do nothing else.
              Also, I've seen the same thing happen with multiple symbols (forex) on the same chart, line type, short time frames. By that I mean that the eSignal generated lines break up the same way my efs line does.
              Thanks again, Jack
              Attached Files
              Last edited by giacomo11; 10-29-2004, 01:51 AM.

              Comment


              • #8
                Hello Jack,

                I stand corrected. I have been seeing the line break today. There appears to be a bug related to the unique combination of an overlaid non-price study where Auto-scaling and Scale Price Data Only options are turned on while the overlaid study is set to Display Right with No Scale.


                The good news is, there is a solution. First, turn off the Scale Price Data Only option. Then go to Edit Studies, select your overlaid study and set its scale and display options to Display Left and Scale Left.


                This will refresh the line properly and prevent this line breaking issue. I've been running this scenario all day and have yet to see the line break. Let me know if you continue to see the problem using this setup.

                In the mean time, I will report this line breaking issue to the development team.
                Jason K.
                Project Manager
                eSignal - an Interactive Data company

                EFS KnowledgeBase
                JavaScript for EFS Video Series
                EFS Beginner Tutorial Series
                EFS Glossary
                Custom EFS Development Policy

                New User Orientation

                Comment


                • #9
                  Hi Jason,
                  Thanks for the reply and for the time you spent on this. However, I have 7 charts on my page and several different overlays. I tried what you tested and it works fine for one overlay but not for more than one, because the scales are different. Maybe there's a way of standardizing the scaling but I can't think of one off hand or maybe I can - I'll have to try something using only the variation in pips with a base of 1.0000 or something.
                  Also, this should be solved for the other situation I described, i.e. Multiple Symbols / line chart / short time intervals. The eSignal generated lines break up just the same as my efs lines do.
                  Thanks again, Jack

                  Comment


                  • #10
                    Hello Jack,

                    The scale of the overlaid study and the scale of the chart symbol shouldn't matter. Make sure you're not using the Scale Price Data Only scaling option for each chart. Make sure the overlaid study is set to Scale Left and Display Left in the Edit Studies option for each chart.

                    Give me an example of a scenario you're having trouble with.
                    Jason K.
                    Project Manager
                    eSignal - an Interactive Data company

                    EFS KnowledgeBase
                    JavaScript for EFS Video Series
                    EFS Beginner Tutorial Series
                    EFS Glossary
                    Custom EFS Development Policy

                    New User Orientation

                    Comment


                    • #11
                      Hi Jason,

                      I did exactly what you said. For one overlay it works fine. For example, the GBPEUR is about 1.4360 and that scale appeared on the left and everything was fine. But when I do the same thing to another overlay on the same chart and the scale is different then the first line disappears completely.
                      For instance, I've made my own $DXC index (of sorts) because the $DXC index only updates every 6 seconds and mine updates on every tick. It's not exact but has the same currency components and the same weighting for each currency (I've attached that efs). Because $DXC varies inversely to the GBP I've inverted the calculation so I can track with the GBP. The scale makes no difference to me - I only look for the movement in the line. But that scale is very different than the 1.4360 +/- 50 pips or so that appears on the GBPEUR scale.
                      When I scale left / display left for one overlay that scale seems to be used to the next overlay and the live goes flat against the top or the bottom of the chart.
                      Thanks, Jack
                      Last edited by giacomo11; 10-29-2004, 01:59 PM.

                      Comment


                      • #12
                        Hello Jack,

                        Having multiple overlaid studies makes our solution for the single overlaid study obsolete due to the sharing of the Left scale. Here's the new solution for you. It's not the most efficient thing to do and I try to avoid it, but in this case it's necessary until we can get a fix for this.

                        Add the repaintChart(); function just above your return statement in main. This will force a refresh of the line. You'll need to add this to each formula. The only problem now is that you will still see the line break. But, the repaintChart() function will get called on the next tick and correct the line so you won't have to manually. There is a slight performance penalty for calling this function on every tick. If you need to improve the efficiency of the formulas you could call the function only at BARSTATE_NEWBAR like this:

                        if (getBarState() == BARSTATE_NEWBAR) repaintChart();

                        And of course you'll need to set the scale for each overlaid study back to No Scale.
                        Jason K.
                        Project Manager
                        eSignal - an Interactive Data company

                        EFS KnowledgeBase
                        JavaScript for EFS Video Series
                        EFS Beginner Tutorial Series
                        EFS Glossary
                        Custom EFS Development Policy

                        New User Orientation

                        Comment


                        • #13
                          Hi Jason,

                          Thanks. I'll try that on Sunday afternoon - it's too late now; FX is closed or at a virtual stand still. I'll use the first option since the line corrects itself automatically on any new bar.

                          Your help is very much appreciated.

                          All the Best, Jack

                          Comment


                          • #14
                            Hi Jason,

                            Thanks again. The repaintChart command works great.

                            All the Best, Jack

                            Comment

                            Working...
                            X