Announcement

Collapse
No announcement yet.

High/low Lines

Collapse
X
 
  • Filter
  • Time
  • Show
Clear All
new posts

  • #16
    SNAPSHOT

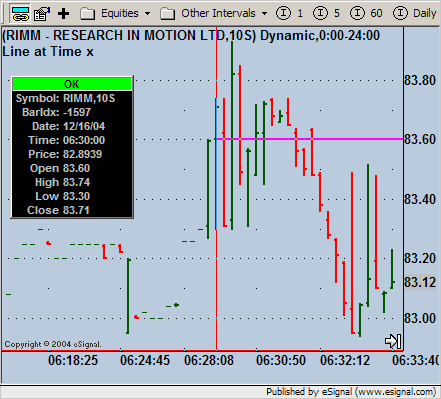
    Jason, here's the opening price line which starts at 6:29:50.
    Attached Files

    Comment


    • #17
      Hello Steve,

      Your formula is starting at the 6:29:50 bar because your formula is redrawing the line for every bar that is < 630. The 6:29:50 bar is the last one drawn on a 10S chart because it is the last bar seen that is less than 630.

      Here's the fix, which is also a simpler way to handle this. It's also slightly more efficient.

      PHP Code:
      var vPrice null;

      function 
      main(vTime,vSource,vColor,vThick,vValue1){ //here add vValue2, vValue3, etc in the parenth
          
      if (getDay(0) != getDay(-1)) vPrice null;  // reset at each new day
          
          
      if(vPrice == null && getHour() * 100 getMinute() >= 630){  
              
      vPrice = eval(vSource);   
              
      clearLineTool(LineTool.RAY);   
              
      addLineTool(LineTool.RAY,getCurrentBarIndex(),vPrice,getCurrentBarIndex()+1,vPrice,vThick,vColor,"Line1");
          }
          
          return;

      Jason K.
      Project Manager
      eSignal - an Interactive Data company

      EFS KnowledgeBase
      JavaScript for EFS Video Series
      EFS Beginner Tutorial Series
      EFS Glossary
      Custom EFS Development Policy

      New User Orientation

      Comment


      • #18
        syntax error

        Jason, thanks for the code and I see how this is simplified. I'm getting error: "line 45, syntax error: missing ) after argument list". I've attached the rewritten code and you can see that the end parenth is there. Have I made a mistake somewhere? Plz advise.


        Steve
        Attached Files

        Comment


        • #19
          Hello Steve,

          I'm seeing more spaces getting added to the code that shouldn't be there. It's not your fault. I'm noticing that the PHP tags when composing my messages are adding some extra spaces that aren't in the original text. Anyway, the correct code is in the attached.
          Attached Files
          Jason K.
          Project Manager
          eSignal - an Interactive Data company

          EFS KnowledgeBase
          JavaScript for EFS Video Series
          EFS Beginner Tutorial Series
          EFS Glossary
          Custom EFS Development Policy

          New User Orientation

          Comment


          • #20
            Hi Jason,

            I am trying to find an efs that will flash the background chart color of $trinq, $tickq and $voldq whenever they hit a new intraday high or low. I keep these open in small 1 day, 2 min, 6:30-13:30 (pst) charts, but sometimes miss when they break the intraday high or low.

            In searching the efs BB, I notice the efs in this thread recognizes new intraday highs and lows. But as I am still somewhat efs challenged, can you tell me, is this efs the best place to start to achieve what I want, or is there another efs you know that might be closer?

            Thanks
            shaeffer

            Comment


            • #21
              Hello Shaeffer,

              getTodayOHLC1.efs is what you'll want to start with. When close(0) is equal to the high or low returned by this formula you can then call setBarBgColor(Color.xxxx).
              Jason K.
              Project Manager
              eSignal - an Interactive Data company

              EFS KnowledgeBase
              JavaScript for EFS Video Series
              EFS Beginner Tutorial Series
              EFS Glossary
              Custom EFS Development Policy

              New User Orientation

              Comment


              • #22
                SNAPSHOT High/Low Lines

                Jason, on 12/15 you posted a revised study called todayshighlow.efs. In general it works well, but sometimes the low line is not drawn early in the trading day. It always updates and is accurate when I "reload" but this should be working automatically. Currently, this is only happening with the low line.

                On this snapshot the low is actually 115.62 at 06:59:30 and no red line has been drawn there (or anywhere else). Perhaps it needs a little "tweak" for the low line but I couldn't find where in your code. I'd appreciate any ideas.

                Also, I currently am running eSignal vs 7.7 build 679, 9/24/04. I'm a power user with a dozen different charts constantly open (one stock per chart), and 6 studies are used on each one. I'm considering vs 7.8 but I've got 7.7 running pretty well. Since you probably know any bugs in the new one do you advise to hold off a while or go ahead with the download? Thanks again.

                Steve
                Attached Files

                Comment


                • #23
                  Hi Steve, shaeffer,

                  FWIW, I had been working on something with cas on this thread which may be of some help on this. This study may be adapted either through the edit studies menu or incorporation of some of the work you have done on this thread to meet your needs.

                  Happy Holidays,

                  Comment


                  • #24
                    Hi Steve,

                    I'm finally getting caught up after Xmas off. I've downloaded the efs from the thread you mention, thanks.

                    Changes I need to make for my purpose are:
                    1. hi/lo lines set on high/low closes (not hi/lo extremes)
                    2. no fixed background color change. Instead background color flashing green/red when high/lows are being exceeded.

                    In my TRINQ chart, I have three fixed background color bands already defined (per attached). Do you know if fixed background colors with a short term flashing background color over-ride is possible? (As I am not real knowledgeable with efs's, knowing if this is not possible would be very helpful).

                    I'll also try the efs Jason mentioned earlier and see if I can sort this out

                    Regards
                    shaeffer
                    Attached Files

                    Comment


                    • #25
                      Hi Shaeffer, I believe you want to address this to Steve Hare as he's the expert and I'm a fairly new subscriber. I think our signals got crossed when he replied to both of us on a thread before Xmas.

                      Good Trading,

                      Steve M.

                      Comment


                      • #26
                        Hi Shaeffer,

                        What you described can be done, what you need to do is check for hi and low conditions on newbar, then you have to make sure you check close(-1) (just completed bar close value) and assign the new high or low to that value.

                        The flashing of the background can be done insomuch that you can have the backgtound color change every tick. I would recommend you do that this way:

                        outside main and premain, declare an array (with your three colors) like this:

                        var Scolor = new Array(Color.red,Color.blue,Color.green);
                        var Scounter = 0;


                        Then, when you are in a situation where you are exceeding your limits (ensure this area is being implemented every tick):

                        setChartBG(Scolor[Scounter]);
                        Scounter++;
                        if (Scounter>2)Scounter=0;

                        If you need any further help, let me know and either I or another person on the board can assist you.

                        Comment

                        Working...
                        X