Announcement

Collapse
No announcement yet.

Inconsistent lines

Collapse
X
 
  • Filter
  • Time
  • Show
Clear All
new posts

  • Inconsistent lines

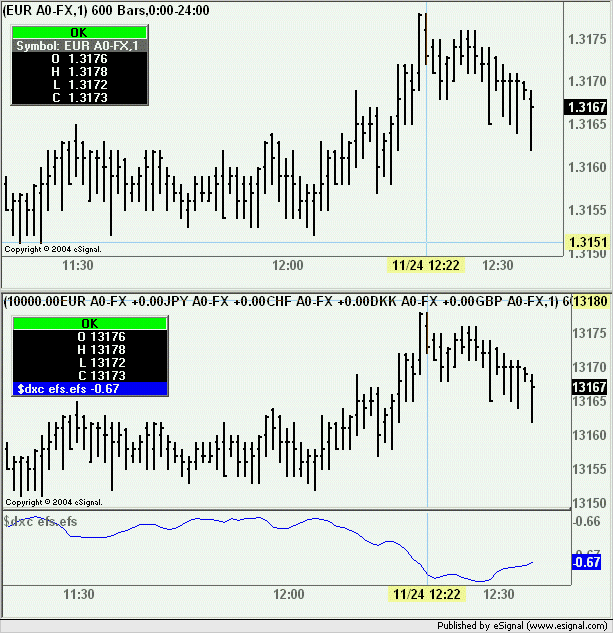
    Hi, I have my own efs studies (lines) on various charts (FX). The exact same efs on different charts gradually takes a different appearance on each chart. If I reload it on each chart, then the lines are identical again for a time but gradually get different again. I tried "reloadEFS()" in the efs but that crashed.

    Any ideas?

    Thanks, Jack

  • #2
    Jack
    The issue could be caused by how you are computing those lines in real time.
    You may want to post your code (or a sample version of it) and someone can take a look at it
    Alex

    Comment


    • #3
      Hi Alex,

      Thanks for jumping in. I'm attaching an efs. It's basically a US Dollar index. The $DXC only updates every 6 seconds, so I made my own, with the same currency pairs and the same weighting of each pair. I then take a 4 bar weighted MA of that. It updates on every tick, so works better for me.

      The repaintChart() command is used because the line breaks up when it reaches upper or lower levels on the chart. That works fine.

      The problem I have now is that the same efs's line looks different after awhile when on different charts. Reloading it makes it identical on every chart. And then it gradually starts looking different again.

      Thanks, Jack
      Attached Files

      Comment


      • #4
        Jack
        I suspect that the issue is somewhat similar to the one discussed in this thread where the symbols used in the efs end up being out of sync in real time.
        To verify this use the following symbol in the main window. The resulting plot should return the same values of a EUR A0-FX chart albeit without the decimal point (see comparison image below)
        10000.00EUR A0-FX +0.00JPY A0-FX +0.00CHF A0-FX +0.00DKK A0-FX +0.00GBP A0-FX
        (FYI you can Copy the expression above and Paste it in the Symbol Change box)
        Then run your efs on that chart and you should see that it does not drift anymore and that if you reload the efs the plot does not change.
        Alex

        Comment


        • #5
          Hello Jack,

          Alex is on the right track with why your study gets out of sync. Modifying your chart symbol as he suggested is one solution to the problem. Let me give a more detailed explanation as to what is going on in the EFS and a code solution.

          The reason the study gets out of sync in real time is because any calls to external symbols within the EFS will be used to trigger executions of the EFS. Normally, the EFS only updates when the main chart symbol updates. By passing external symbols to the getValue() function, EFS will remember those symbols and force the EFS to update when any of the external symbols has an update. The problem here is that the new bar for the chart can only be created when an update of the main chart symbol occurs during the new interval. For example, let's assume we are looking a 1 minute chart and we are currently at 10:45:15. If the first trade for the 10:45 1 minute bar for our main chart symbol occurs at that time a new bar in our chart forms. However, there was 15 seconds where the external symbols received updates, which triggers an execution of the EFS but does not start the new bar. So those price updates get reflected on the 10:44 bar even though they should be on the 10:45 bar. Therefore, in real time your study can get out of sync.

          If you want a code solution where you don't need to change the chart symbol as Alex suggested, try the attached. The reloadEFS() function is not the best solution in the case. The reason you were crashing with this function is because you probably just added it to main like repaintChart(), which creates and endless loop. All we need to do is correct the -1 bar at NEWBAR. I added a function to your study that recalculates the proper value for the -1 bar and use the setBar() function to correct it.
          Attached Files
          Jason K.
          Project Manager
          eSignal - an Interactive Data company

          EFS KnowledgeBase
          JavaScript for EFS Video Series
          EFS Beginner Tutorial Series
          EFS Glossary
          Custom EFS Development Policy

          New User Orientation

          Comment


          • #6
            Hi Jason and Alex,

            I tried both and neither seems to solve the problem.

            I should probably have mentioned that the efs is super-imposed onto the chart.

            With the 10000.0EUR ... the efs lines I have on the chart plaster up against the top of the chart. I made sure they were "no scale" & "no display" and "display price only" was unchecked for chart.

            The fix last bar efs did the same as before. After a few bars it looks different on different charts, one on the EUR A0-FX and the other on the GBP A0-FX.

            Thanks for taking the time to look into this. I understand what is happening now, but it's still happening.

            Best, Jack

            Comment


            • #7
              Hello Jack,

              The fix I provided appeared to be working from what I was looking at. However, I was using Scale Left and Display left with the study overlayed onto the price window. Try that and if you still think it's not correct, please post some before and after chart images so we can see visually the problem you are seeing. Post some images of the two charts just after applying the formula and then post a couple more images of the same charts after some time has passed. Also, make sure you don't cover up the symbol and time template info displayed in the top left of the chart. That will be helpful in resolving this issue.
              Jason K.
              Project Manager
              eSignal - an Interactive Data company

              EFS KnowledgeBase
              JavaScript for EFS Video Series
              EFS Beginner Tutorial Series
              EFS Glossary
              Custom EFS Development Policy

              New User Orientation

              Comment


              • #8
                Hi Jason,

                I can't use that solution. I have up to 4 different added overlayed efs lines on my charts. I've tried scale left and display left; this works for one efs line but for 3 or 4, since the scales are all different.

                Maybe something that doesn't allow the efs to update until the first tick / newbar on the symbol for the chart. I'm trying to figure out how to do that. I was out for a good part of the day, which is why it took so long for me to test the solutions and reply.

                Thanks again, Jack

                Comment


                • #9
                  Hello Jack,

                  Again, we'll need to see some chart images to get a better understanding of the problem you're describing. In the mean time, have you tried adding setComputeOnClose() to preMain()? This will prevent the study from updating during the current interval. Let us know if that works for you.
                  Jason K.
                  Project Manager
                  eSignal - an Interactive Data company

                  EFS KnowledgeBase
                  JavaScript for EFS Video Series
                  EFS Beginner Tutorial Series
                  EFS Glossary
                  Custom EFS Development Policy

                  New User Orientation

                  Comment

                  Working...
                  X