Announcement

Collapse
No announcement yet.

Syntax Error Help

Collapse
X
 
  • Filter
  • Time
  • Show
Clear All
new posts

  • Syntax Error Help

    I'm getting this syntax error: Line 108, missing ; before statement: vflag2=1);

    There is a ";" before that statement as shown at end of line 107.
    I've deleted/retyped that ";" double-checked indentations, and removed/reinstalled on the chart.

    Haven't seen this problem before and can't solve it. Could someone plz guide me in the right direction? Thanks.

    Steve
    Attached Files

  • #2
    Steve
    Remove the ) in vflag2=1); in line 108
    Alex

    Comment


    • #3
      Hi Alex, this worked great, thanks!

      I have attached a study you wrote called "builtinbb(smart1-alerts)" which works fine. Is it possible to code another alert condition, i.e. if volume >= "x"? I display volume on my charts with a study called "volume clipped" which I could also send if you're able to take a look at this.

      Thanks again for all the help you've given me.

      Steve
      Attached Files

      Comment


      • #4
        Steve
        Insert an empty line between lines 93 and 94 of the efs you posted and in it write
        volume() >= nn &&
        Substitute nn with the value that the volume needs to be higher or equal than.
        Repeat the same between lines 104 and 105.
        Since you are not plotting the volume anyhow but just using it as one of the conditions you do not need to post the other efs.
        Alex

        Comment


        • #5
          Alex, I coded the volume condition as you suggested but can't get it to work. On lines 94 & 106 I inserted....volume() >= 10000 &&. I also tried making a variable for the volume on line 57....
          var volumecurrent = volume(0), then changed 94 & 106 to
          volume (0) >= 10000. I did this thinking that it was looking for which bar to determine the volume condition.

          I've attached a snapshot of YHOO: the alert was triggered because the original conditions were met, as shown by my aqua "x". The cursor window shows the volume at 3600 so the 10000 condition is not being met. I checked this with several other stocks with the same result. I have no idea how to fix this so I need your help. Plz let me know what you think. Thanks again.

          Steve
          Attached Files

          Comment


          • #6
            Steve
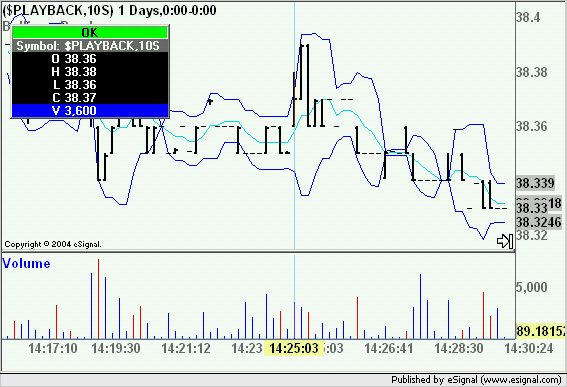
            FYI I downloaded today's tick data for YHOO to run it in Tick Replay on a 10s chart while using the efs modifed as per my suggestion.
            Note that in the downloaded data I am showing the 11:25:03 bar with Volume at 3600 (in the image the time stamp is 14:25:03 as I am on ET)


            I then performed three test runs on that data using the efs. The triggered alert list for one of those runs is attached as a txt file. The list shows the time stamp (ET) of the bar on which the alert was triggered, the Volume when the alert was triggered and if it was a High or Low alert. As you can see no alerts were triggered with Volume less than 10000. Also no alert was triggered at 14:25:03. When the alerts did trigger the Volume was always at or above the preset threshold of 10000.
            At this point as far as I can see the efs is working.
            Alex
            Attached Files

            Comment


            • #7
              Alex, thanks for running the tests. Your tick data w/ efs study appeared to work perfectly on your system but it still doesn't on mine. I enclosed a snapshot for AAPL today which shows (2) alerts and volume less than 10k. I checked several other stocks and they seemed to be very accurate. Questions.....

              1. Re: YHOO yesterday: the snapshot you included was w/o the study, yet it showed exactly the same results as the snapshot I sent you which included the study. (14:25 alert, vol 3600). How can this happen?

              2. How do I run the tick data with the efs (like you did)? I downloaded the tick data but don't know how to apply the efs.

              3. Why do most of my stock charts seem to be very accurate re: the minimum volume condition, but 1-2 charts each day are not?

              Sorry about the time involved with this but it doesn't make sense that the study worked perfectly for you and not for me. Possibly I'm missing something or there's something weird going on.

              Again, I really appreciate the help you've given me.

              Steve
              Attached Files

              Comment


              • #8
                Steve
                1. I am not sure I understand what you mean with "the snapshot you included was w/o the study"
                The screenshot I posted is of a chart running the same study that is attached to an earlier message in this thread and to which I added the same exact Volume qualifier I suggested to you. You can see a glimpse of the study title behind the Cursor Window. As to the Volume study that is the one available in Basic Studies.
                2. For instructions on how to use the Tick Replay tool download Tick Playback.doc which is available here. You can apply an efs to a chart running in Tick Replay just as you normally would in real time.
                3. Regretfully I do not have an answer to this question
                FWIW I have also run multiple tests on yesterday's data for AAPL and the results are consistent with my prior findings ie that the alerts trigger only on volume equal or greater than the preset threshold. Once again as far as I can see at my end the efs is working as intended and I don't believe that any further tests would change the outcome
                Alex

                Comment


                • #9
                  Alex, I'm sorry, my mistake on #1. Will use your tickplayback.doc to test condition alerts on my computer. Thanks again.

                  Steve

                  Comment

                  Working...
                  X