Announcement

Collapse
No announcement yet.

change after upgrade

Collapse
X
 
  • Filter
  • Time
  • Show
Clear All
new posts

  • change after upgrade

    I recently upgraded to version 7.8 and everything went fine - except for 1 thing.
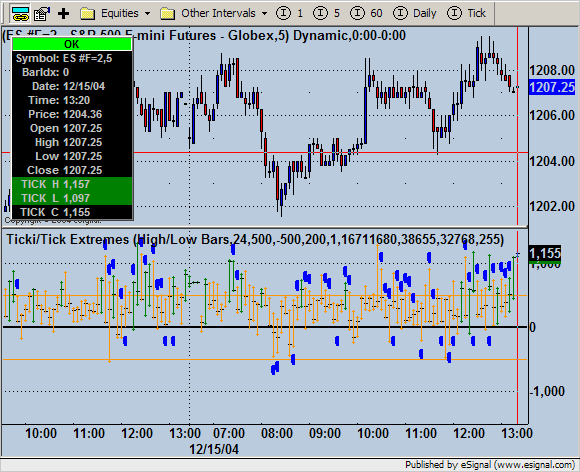
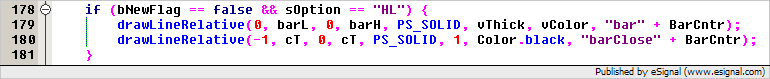
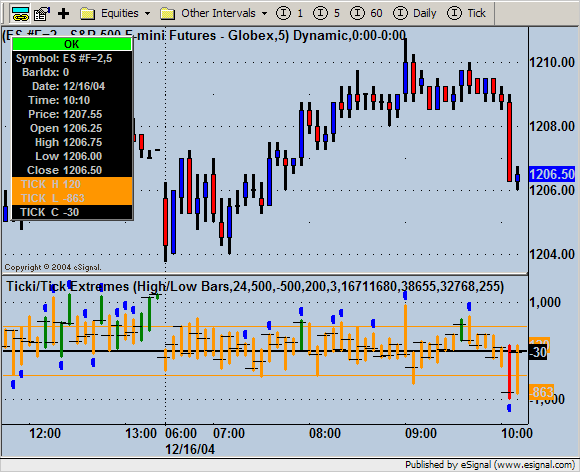
    I use the script ticktiki.efs ( I will include it with this post) and and after the upgrade the little black hashmark that represents the current level of tick (in real time) got very small - almost unnoticable, at least comparitively speaking. I want to clarify what little mark I am talking about - it is the equivilent of a closing mark on a standard bar chart. except it is on the tick bars. I looked at the efs code in the editor to see if there was something obvious to a layperson like myself (when it comes to efs code) but could find nothing. I will try to include a picture of my chart and a copy of the efs.
    Thanks,
    Graham Davis

    I am not sure if I was able to get a picture in here or not
    Attached Files
    Last edited by GDAVIS01; 12-13-2004, 08:10 AM.

  • #2
    Hi Graham,

    Here is what I am seeing with the EFS you attached. Are you seeing something similar? I am also running eSignal 7.8.

    Comment


    • #3
      In edit studies change the histogram to a bar chart. The little hash mark that represents the close for that bar is what is very small now - yes, I am running 7.8 - that is when the little hash mark changed from a normal size that I could see to something thats is about the size of 2 pixels on my monitor.
      Thanks
      Graham Davis
      If you tell me how to post a chart - I will show you what mine is looking like

      Comment


      • #4
        Graham
        Capture a screenshot of the chart, save it to a folder on your computer and then attach it to your message. To attach a file scroll down the page while composing the message until you find a section called Attach File (see image below). Click the Browse button and navigate to the folder where you saved the image and select the file
        Alex

        Comment


        • #5
          OK Alexis,
          Attached Files

          Comment


          • #6
            same file on different computer

            here is a shot of the same EFS on laptop. The black little mark look correct on this shot. If there is anyway around reinstalling esignal on the other system, that would be greatly appreciated. Here is a shot of the correct look

            Comment


            • #7
              here is the chart
              and I just realized that is version 7.7 on this computer
              Attached Files
              Last edited by GDAVIS01; 12-15-2004, 02:04 PM.

              Comment


              • #8
                Hello GDAVIS01,

                I'm using 7.8 and have the black hash marks for the closing prices. In the image you posted where you can't see the black marks, I think you just have your bar spacing too tight. The body of the candlesticks is just covering up the black marks. If you widen your bar spacing you shoud see them.


                Or you could change the formula parameter for "Thickness of Bars" from 3 to 1, which should also make the black marks visible again.


                Jason K.
                Project Manager
                eSignal - an Interactive Data company

                EFS KnowledgeBase
                JavaScript for EFS Video Series
                EFS Beginner Tutorial Series
                EFS Glossary
                Custom EFS Development Policy

                New User Orientation

                Comment


                • #9
                  Hi Jason, and thanks for the reply. Since you are an expert on programming maybe you can help me figure this out - if it's simple enough for me. I pulled the spacing apart and I did get a chart like yours. I'll post it here. The probllem is I do like my charts crunched up like I have them and if you look closely - the little marks that I posted on version 7.7 - the marks went OVER the bar. I should say they printed "on top" of the bar - not under - like what Im getting now. I went into properties and checked "draw lines on top of prices" but that doesnt seem to do anything. If there is a simple way to print the marks on top - that would be perfect.
                  Here is what I have now
                  Attached Files

                  Comment


                  • #10
                    Hello GDAVIS01,

                    I see what you're talking about. In 7.8 there were some changes made that rearranged the order of how things appear on the chart to send the chart background coloring from EFS to it's proper location. This change must have affected the order for EFS drawn objects and indicators. The body of the candlesticks are drawn from drawLineRelative and the black hash mark is an indicator with the flat lines plot type. To properly fix this we would need a new feature added to give us control over z-order to fix this. Please send a suggestion to have this added to
                    [email protected].

                    In the mean time, we can draw another series of lines that will give you the same affect. The black hash marks will be extended to the left by one bar, but it seems to work pretty well. On line 180, or right after the drawLineRelative() function that draws the body, add the following line of code.

                    drawLineRelative(-1, cT, 0, cT, PS_SOLID, 1, Color.black, "barClose" + BarCntr);

                    This code section in your formula should look like this after adding this new line.


                    Jason K.
                    Project Manager
                    eSignal - an Interactive Data company

                    EFS KnowledgeBase
                    JavaScript for EFS Video Series
                    EFS Beginner Tutorial Series
                    EFS Glossary
                    Custom EFS Development Policy

                    New User Orientation

                    Comment


                    • #11
                      much thanks

                      Jason,
                      Thankyou very much,
                      This is a huge improvment for the problem I was having.
                      If there is an easy way to increase the little mark thickness that would be the icing on the cake. If its invloved or time consuming - well I can live with this no problem.
                      Take it easy,
                      Graham

                      Comment


                      • #12
                        Graham
                        In the line Jason provided increase the value shown here in bold red
                        drawLineRelative(-1, cT, 0, cT, PS_SOLID, 1, Color.black, "barClose" + BarCntr);
                        Also increase the value in bold red in the following statement which is in line 15 of the efs
                        setDefaultBarThickness(1, 2);
                        Hope this helps
                        Alex

                        Comment

                        Working...
                        X