Announcement

Collapse
No announcement yet.

Parabolic SAR

Collapse
X
 
  • Filter
  • Time
  • Show
Clear All
new posts

  • Parabolic SAR

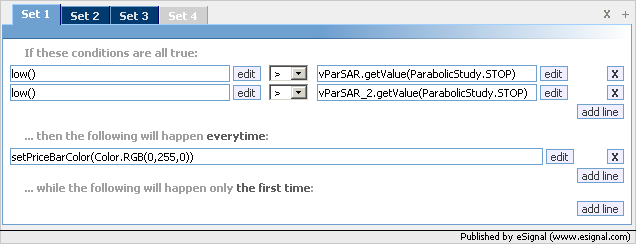
    I am currently changing your Parabolic SAR program in particular the colors of the actual parabolic charting "plus signs". In your study where it shows the following:

    if (vPSAR.getValue(ParabolicStudy.STOP) > high()) setBarFgColor(Color.red); //
    else if (vPSAR.getValue(ParabolicStudy.STOP) < low()) setBarFgColor(Color.green)

    where do I find the list of colors that I can put into the "red" and "green" fields in the above formula. I tried typing in the color "orange" and it comes up as a syntax error " wrong color". Any suggestions ??? Thanx for your help. Paul W.

  • #2
    Paul
    You can find a list of the available "plain language" colors here. However you can also define the colors as RGB values in which case I would suggest you download Chris Kryza's RGB Calculator from here. File name is RGB.zip
    Alex

    Comment


    • #3
      Parabolic directional arrow

      I have attached a copy of the Parabolic SAR program(the actual chart) that originally came from your program in October 2003 that changes colors and sounds when the Parabolic SAR went from a long to a short and vice versa.
      My question is : Is there any way to have little up/down arrows appear to the right of the "PSAR-SLOW" & "PSAR-FAST" lablels in the cursor window. For example: in the attached file, look at my cursor tracking line at 11:16 a.m. where the parabolics go from a short to a long turning colors from pink/yellow to blue/navy. I would like up arrows appearing to the right of the "PSAR-SLOW 1168.00" & an up arrow appearing to the right of the "SAR-FAST 1168.00" labels in the acutal cursor window. On the other hand at 11:39 a.m. where the parabolics change back to a short, I would like the arrows changing from up to down. I know you can program these arrows in the actual chart but I would like them in the actual cursor window. Is that possible ? I dont think it is but I thought I would give you a shout, since if there was anybody that would know, it would be you. Thanx for your help, Paul
      Attached Files

      Comment


      • #4
        Paul
        That is not possible because adding an arrow or other symbol, letter, etc to the value returned by the efs will convert that value to a string which cannot be plotted on the chart.
        Alex

        Comment


        • #5
          Dual SAR's

          Is it possible to paint the candlesticks Green when the price is above Dual SAR's and paint the candlestick yellow when it is above one SAR and below the other SAR and finally paint the candle stick RED when the candlestick is below both SAR's.
          I tried to do this on my own using Formula Wizard but could not do it. Maybe it is not posssible.
          Thanks for your time..Greg

          Comment


          • #6
            Greg
            It is possible to do that with the Formula Wizard. Declare the two Parabolic Studies and then in the first conditional statement (ie Set1) you check for the low to be greater than both Parabolic studies and you paint the bar in green (see following example)


            In the second conditional statement you will instead look for the high() to be less than the two Parabolic Studies and paint the bar in red.
            Then in Set3 you just need to create a condition that will always be true if either Set1 or Set2 returns false. For example you could use 1==1 and paint the bar in yellow
            The result of these conditions is shown below. If you have any problems post the efs as you have written it and someone may be available to assist you.
            Alex

            Comment

            Working...
            X