Announcement

Collapse
No announcement yet.

Colored bars

Collapse
X
 
  • Filter
  • Time
  • Show
Clear All
new posts

  • Colored bars

    Dear sirs,

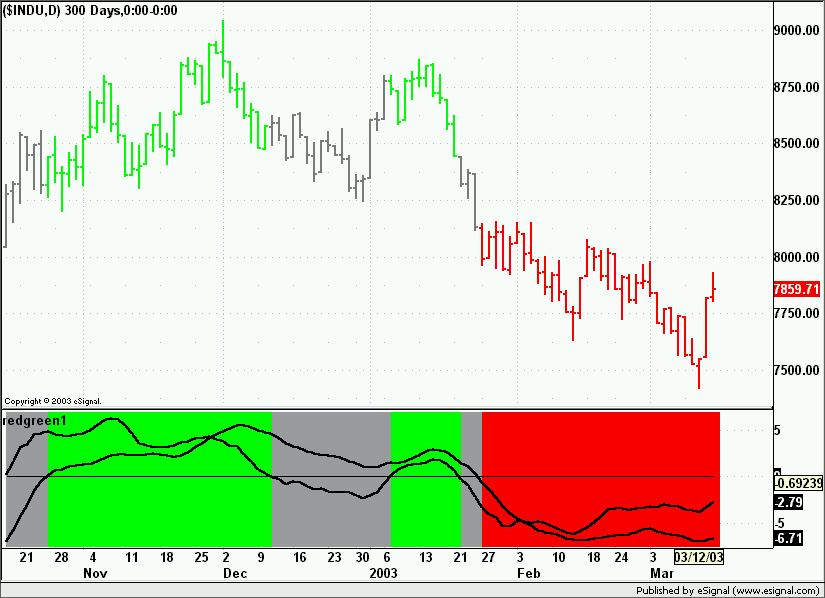
    I want to have my current price bars on chart "green" for example when two of my indicators are "green",
    "red" when the same indicators are "red", and "grey" in the other cases.

    How can I program that in esignal ?

    Kind regards

    philippe bereau

  • #2
    Sample of how to color the bars based on a close above or below the 10 ma is shown in the following efs

    var vEMA10 = new MAStudy(10, 0, "Close", MAStudy.EXPONENTIAL);

    function preMain(){
    setStudyTitle("pbFreeBee");
    setColorPriceBars(true);
    setPriceStudy(true);
    }

    var vLastAlert=1;

    function main(){

    setPriceBarColor(Color.grey);

    if (
    vEMA10.getValue(MAStudy.MA) > close()
    ) onAction1();

    if (
    vEMA10.getValue(MAStudy.MA) <= close()
    ) onAction2();
    }

    function onAction1() {
    setPriceBarColor(Color.red);
    vLastAlert = 1;
    }


    function onAction2() {
    setPriceBarColor(Color.lime);
    vLastAlert = 2;
    }
    Attached Files

    Comment


    • #3
      Philippe

      Here is an efs that plots two Price Oscillators. When both Oscillators are above 0 the price bars are painted in green and so does the background of the indicator. If both Oscillators are below 0 then price bars are painted in red and so is the background of the indicator.
      All other conditions paint the bars and background in grey.


      Open the efs with the Editor and you will see that each Oscillator sets a red or green flag independently which means you could paint the bars based on other conditions also (for example yellow if the 5-35 is above 0 and the 10-70 is below etc)

      Alex
      Attached Files
      Last edited by ACM; 03-15-2003, 05:58 AM.

      Comment

      Working...
      X