Announcement

Collapse
No announcement yet.

Inverse TRINQ

Collapse
X
 
  • Filter
  • Time
  • Show
Clear All
new posts

  • #16
    shaeffer
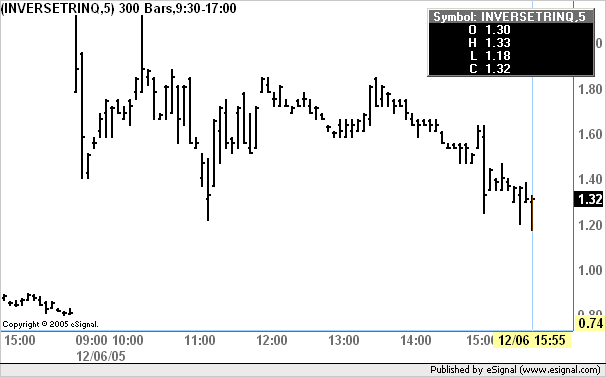
    The problem you are having with the chart of 1 / $TRINQ ending earlier is probably related to the issue described in this thread.
    You can resolve it in the interim by either switching to a 24 hour Time Template or creating a temporary Time Template that extends the End time by 1 hour. In the attached image you can see that the Time Template is set to end at 17:00 instead of the normal 16:00 and the last bar is time stamped 15:55
    Alex

    Comment


    • #17
      Blank Chart Window to view EFS only?

      Adding the extra hour to the time template worked, so my TRINQ chart problem is solved. Thank Alex.
      ------------------------------------------

      I'm still wondering though, if I use/modify a symbol in an EFS, can I view just that EFS? To do that, can I somehow open a chart window with no symbol in it, so that when I open an EFS in that blank chart window, all I see is the EFS?

      Thanks
      shaeffer

      Comment


      • #18
        shaeffer
        You cannot have a chart without plotting a symbol.
        Having said that if the efs is plotting in the indicator pane then you can extend that pane so that it takes up all of the window.
        Alex

        Comment


        • #19
          Hello

          FWIW...could you not just color the bar/candle/line the same color as the background on the chart so that you will see the samee color. So if the bar chart is colored white up and white down...with the background being white. then you will nothing but ...white. You could then add any indicator and see it if it was any other color but white like black, yellow etc.

          Should work.

          Pogman

          Comment


          • #20
            Hi Pogman. I did try that once, but the trace of the 'invisible' chart symbol cut thru my EFS plot (chopped it up). But making the EFS line thicker, and the other thinner, might reduce that. Also I seem to recall some EFS command defining if the EFS plot overlayed the chart, vs chart overlaying the EFS.

            And after changing the main symbol color to match the background, Alex's idea looked good .

            Now that I know there must be a primary chart symbol, I'll see which of the above options works best.
            Thanks for the suggestions

            shaeffer

            Comment

            Working...
            X